Lost in calls and chats
Work was assigned on calls and locations shared on WhatsApp. Details got lost, and collectors were often unsure what to collect where.
Case study · Mobile app
I designed the Mynzo Partner App, the mobile app our field partners use to collect plantation and survey data. Rebuilt around field research, it took two people to 400 data points in two days, up from 25 to 30 a day.
I designed the app around the people who use it in the field. I went to their environment to see how data is really collected, worked out the data the business needs and the parameters it is judged on, and turned that research into solutions.
The sections below follow these steps. Version 1 itself came first, built before any of this research.
How they work today, and the environment they work in.
Contextual inquiry · Current journey · Problems
Jump to section →The jobs the app has to carry, and what it must get right.
Jobs to be done · Principles
Jump to section →Our first version, built in a short span with no real-user context, then tested with the actual users to understand its fallbacks.
Personas · First screens · Fallbacks
Jump to section →Worked on those fallbacks, with a clearer view of the real field scenarios.
Field scenarios · Trade-offs
Jump to section →The redesigned app, tested with users in the field and reflected on.
Version 2 · Testing · Reflection
Jump to section →Version 1 was an MVP, built before our first client, around hypothetical personas we imagined. We then took it to the actual users on the ground, to understand how data collection really works. Meet the personas
A working MVP, built in a short span around hypothetical personas, before our first client, and released to them.
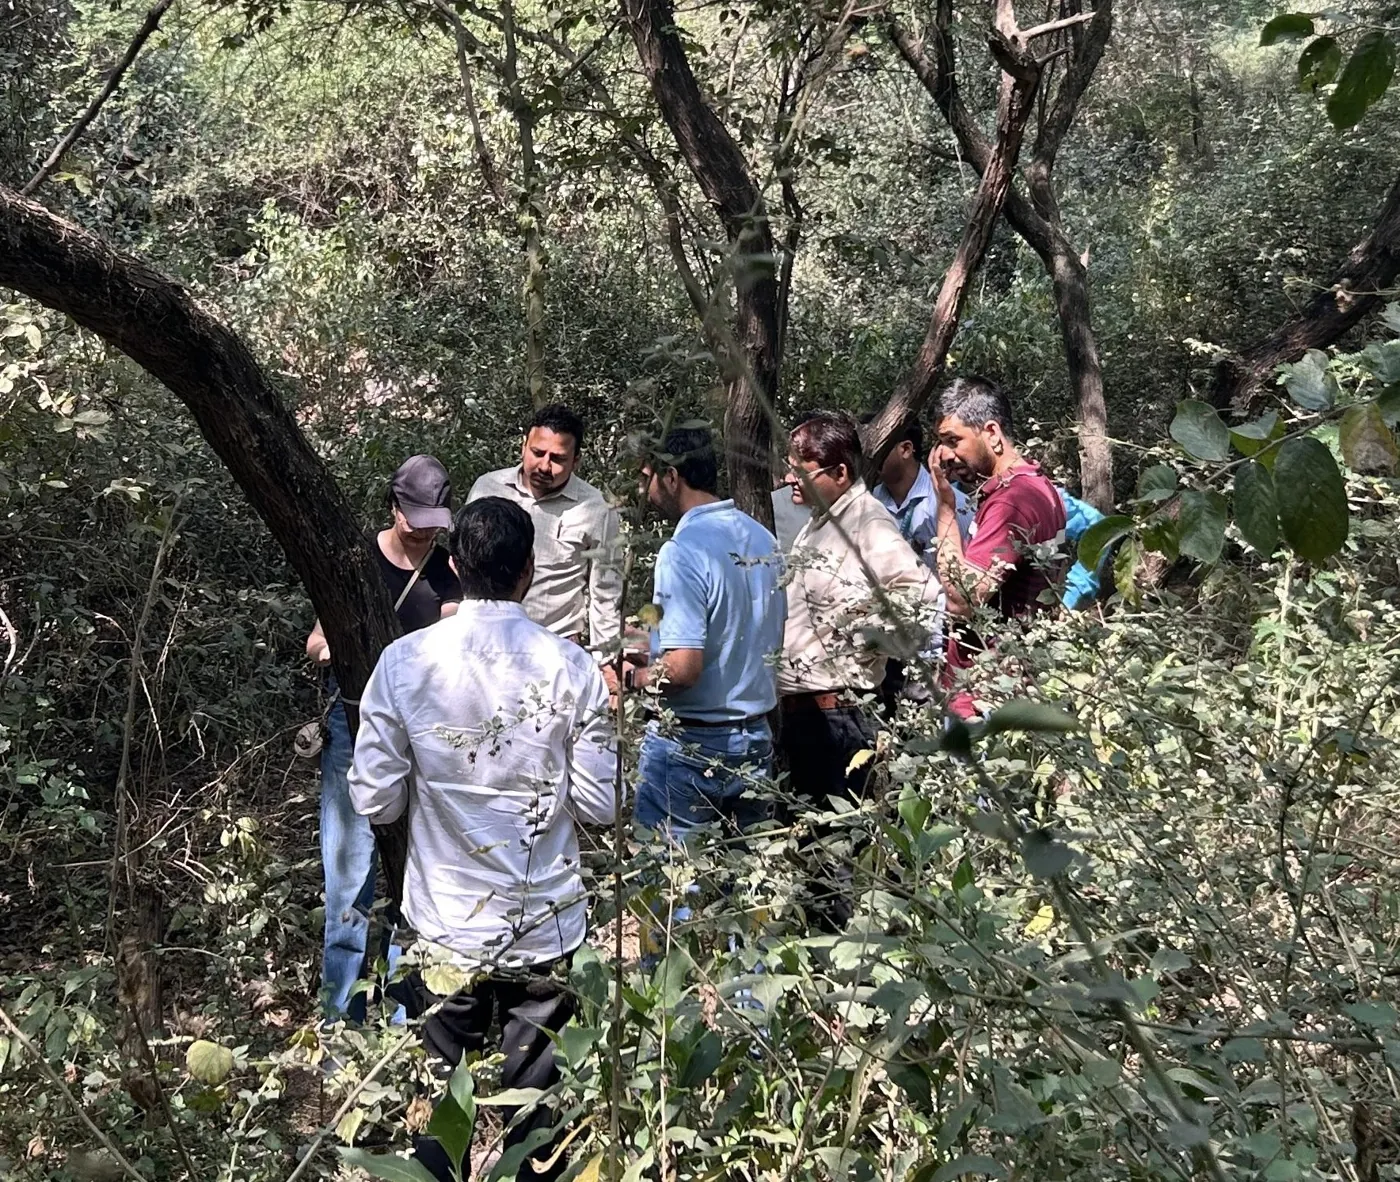
In Araku Valley we saw how users collect data today, and how they did it before the app. We came away with a clearer picture of their environment, who they are and what matters most.
We set the jobs to be done and the design principles, to remove the problems we saw users facing.
We tested it with the actual users in the field, against real working conditions.
The app they use today, with farmer onboarding and biodiversity added as the startup grew. Two people collected 400 data points in two days.
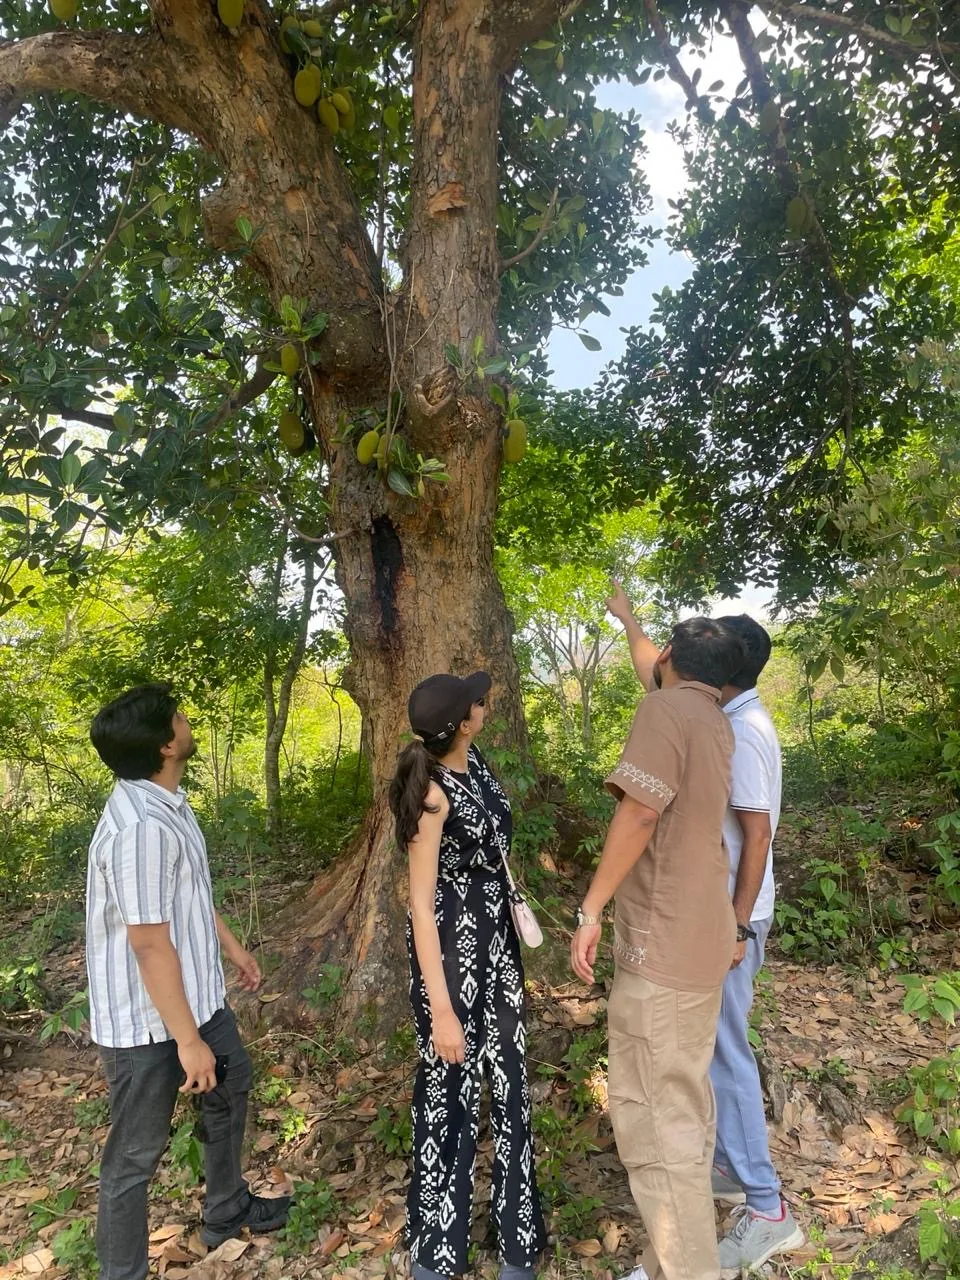
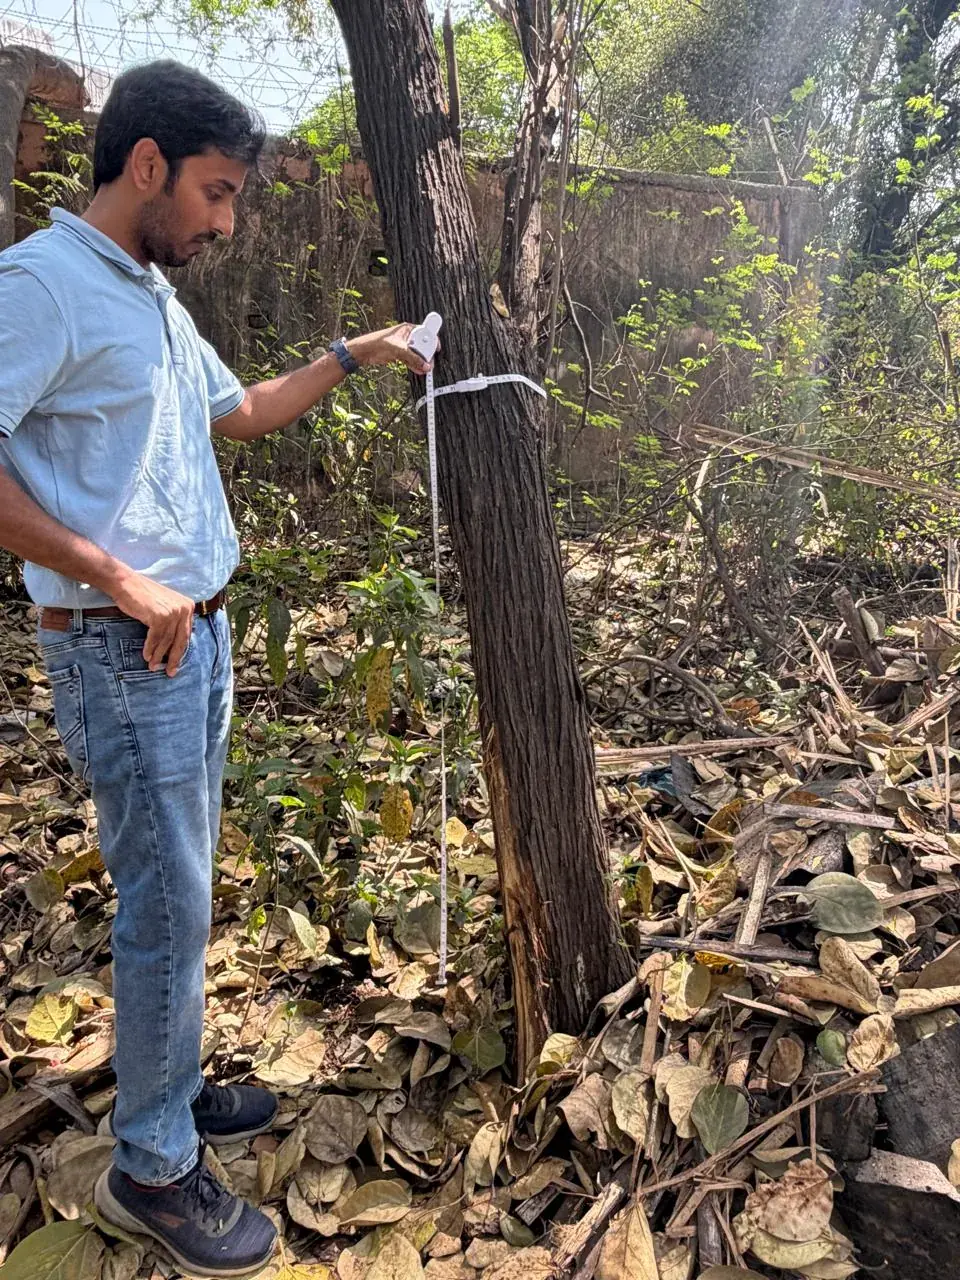
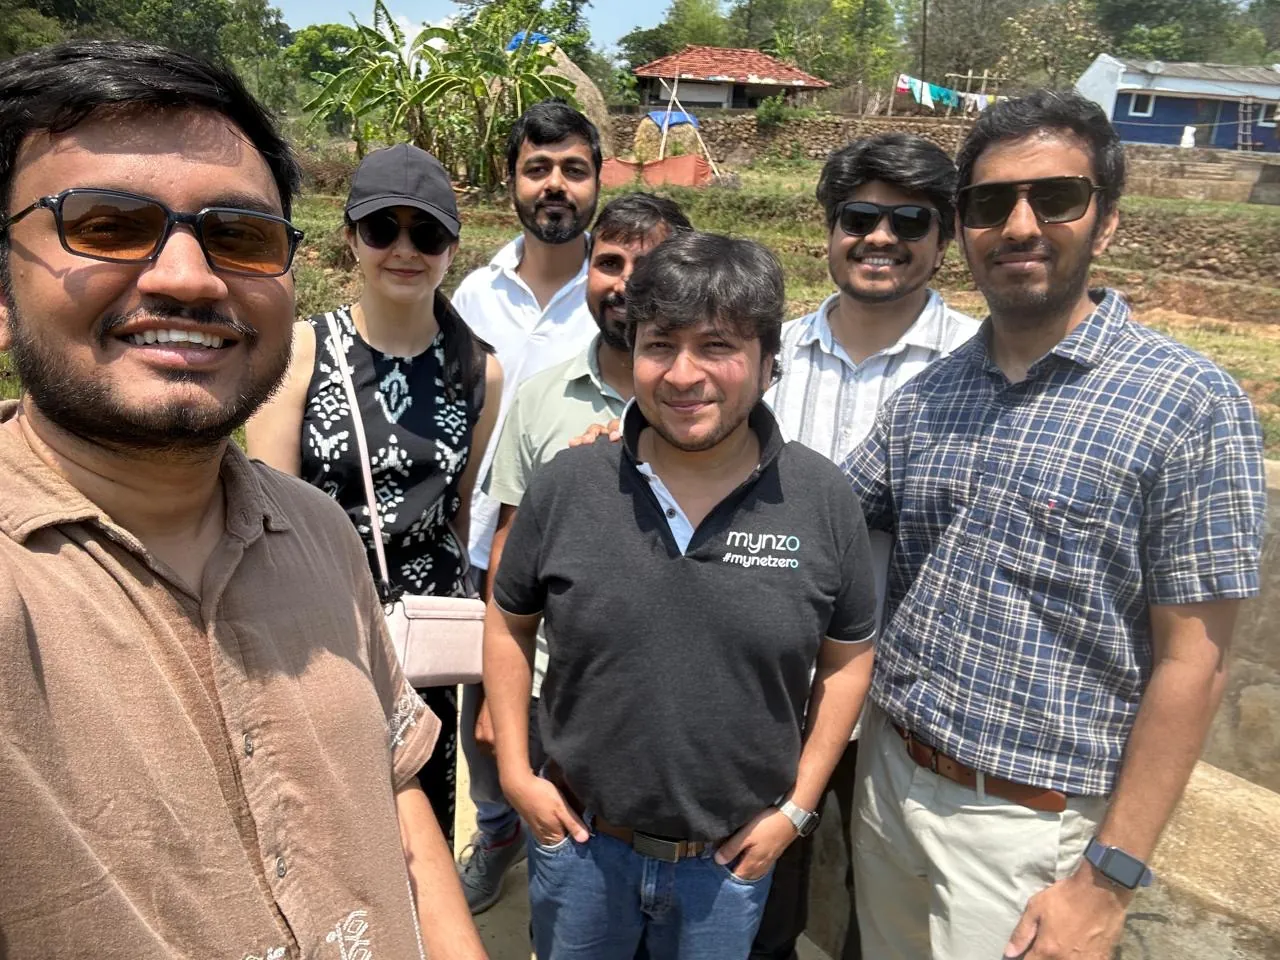
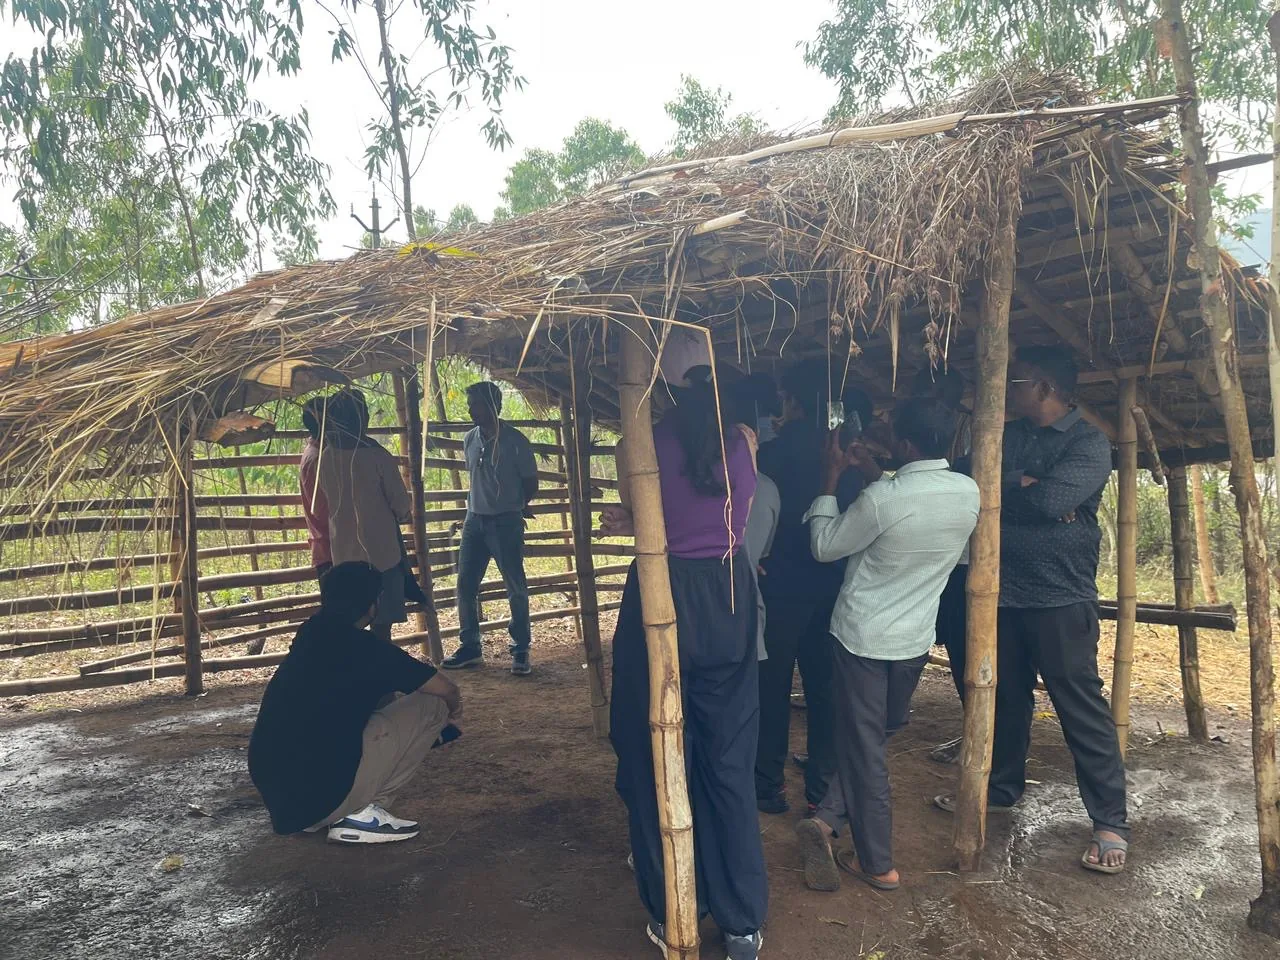
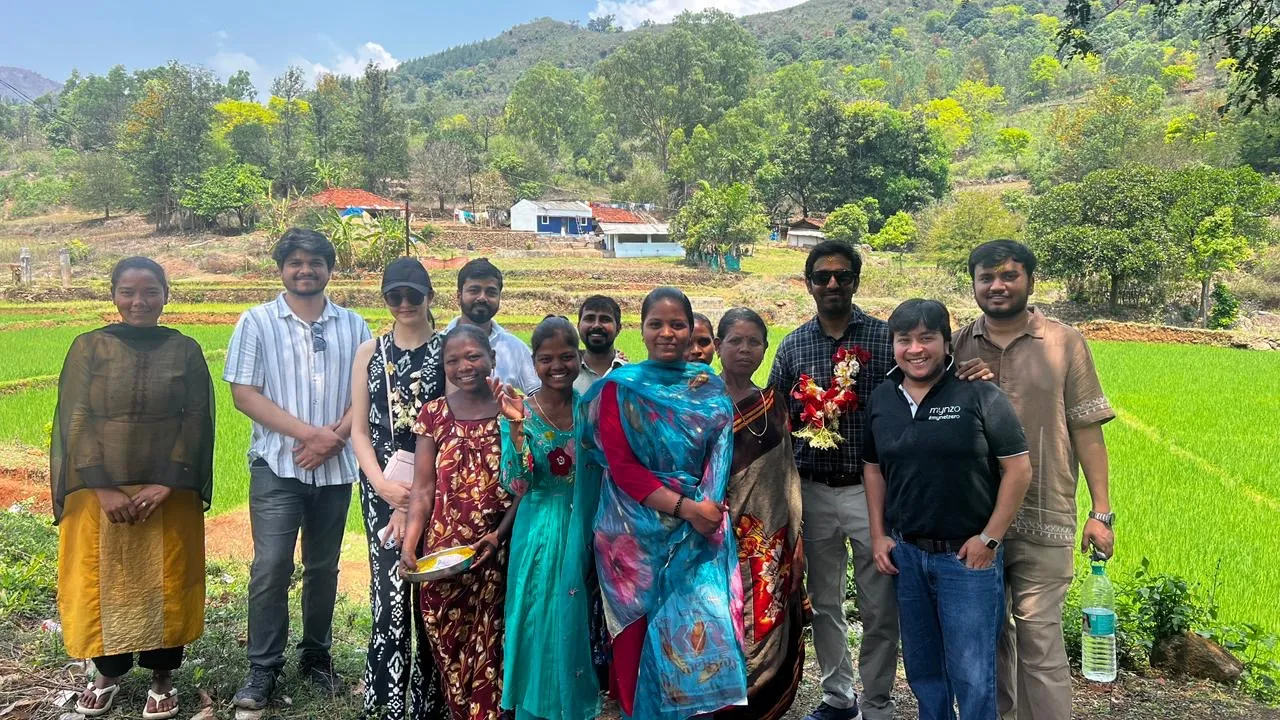
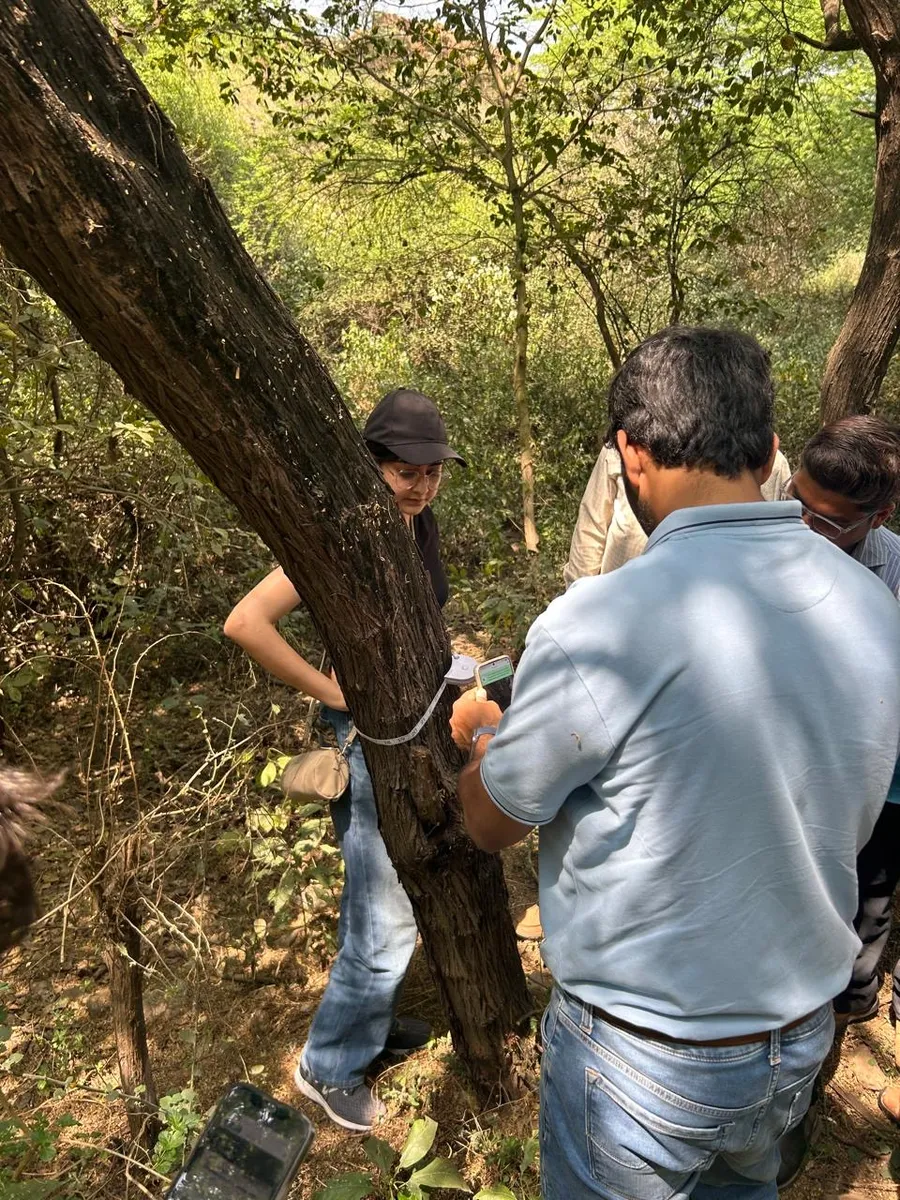
I travelled with my team to Araku Valley in Andhra Pradesh, India, to see how users collect data with the current partner app, and how they collected it before the app. We also tested the new partner app with them.
Two roles use the app in the field, defined by the job they do. A third person, the manager, depends on the data they collect.
Field data collector
Farmer documentation
Does what
Walks to assigned boundaries and records plantation, growth and biodiversity data, across several boundaries in a day.
Visits farmers and landowners and completes their documentation, so their land can join a project.
Works where
Inside forests and plantations, often with no signal, for a full day on one charge.
On site with the farmer, for the documents, interview, verification photo, contract and land boundary.
Uses in the app
Plantation data · Growth data · Biodiversity data
Farmer onboarding
Needs to
Finish every assigned boundary, and spend less time on the phone, more on the work.
Complete each farmer's documents, and pick up where they left off if a visit is cut short.
Gets in the way
For both roles: instructions lost in calls and chats, details typed by hand with typos, and labels in English, when many partners are more at ease in their own language.
One person or two
Some companies give both jobs to one person; others assign them to different people. The app has to work either way.
Also affected: the manager. They assign boundaries on the dashboard and receive the data, without rebuilding it in Excel first.
Where the growth data goes
To calculate the carbon stock, companies collect growth data for a sample of the trees in a plantation, around 10% in our case. Growth data means the height, leaf and girth of each sampled tree.
Allometric equations then turn this sample into the sequestration for the entire boundary, which is shown on the dashboard.
This is the journey users currently follow to collect field data. The manager calls each field collector and sends the boundary location on WhatsApp. The collector navigates there and photographs everything with an app called NoteCam, which keeps every type of data in one pile of photos, saved in the phone gallery. The photos are then sorted by hand and sent on WhatsApp with typed details, and the manager rebuilds it all in Excel.
From the current journey
Work was assigned on calls and locations shared on WhatsApp. Details got lost, and collectors were often unsure what to collect where.
Every photo, from plantation to soil, landed in the same camera roll, with nothing to say what each one was.
After a long day in the field, collectors spent their evening sorting photos into categories. Field collection became slow.
Species, circumference and height were typed manually for every photo. Typos crept in, and the data became inaccurate.
The manager re-entered everything into Excel before a report could go out. Slow for everyone, and one more place for errors.
Problem
Field data was collected and passed on by hand, through calls, WhatsApp, a camera app and Excel. As a result, field collection was slow and the data that reached the dashboard was often inaccurate.
Goal
Make field collection fast and the data accurate by default, with one offline-first app where every photo carries its own data and goes straight to the dashboard.
In a single day, one partner may onboard a farmer, map a boundary, and record plantation, growth and biodiversity data. The app has to carry all five jobs without getting in the way.
 01
Collect identity and land documents, interview the farmer, take a verification photo, upload the contract and map the land
 02
Create a boundary inside a forest, or a standalone one, by drawing it or walking it
 03
Record the species and number of saplings planted, with photos of the site
 04
Photograph trees and saplings and mark circumference, height and leaf on the photo
 05
Record fauna, flora, water and soil, with photo, video or voice
1We saw
Partners lost time, and sometimes data, waiting for a network that never came. A long day also drained the phone.
2We asked
How might we let partners collect everything with no network at all?
3So the app is
Every entry is saved on the phone the moment it is captured. Partners sync once, back home, and can keep battery saver on all day.
1We saw
Species, circumference and height were typed for every photo. Typos crept in, and the data became inaccurate.
2We asked
How might we make accurate data the easy way, not the extra effort?
3So the app is
The photo carries the data. Measurements are captured as photos, date and GPS fill themselves, and a sample image shows what a good photo looks like.
1We saw
Most partners are not comfortable reading English, so labels and instructions slowed them down and led to mistakes.
2We asked
How might we make every screen clear without English?
3So the app is
The whole app switches to the partner's language in one tap, with eleven Indian languages and an icon on every job.
1We saw
Work arrived over calls and chats, so collectors often didn't know which boundary to cover next, or what was still pending there.
2We asked
How might we show partners what matters for the spot they are standing on?
3So the app is
Boundaries open nearest first, every job is one tab away, and each boundary shows its own history.
With the Partner App, nothing travels through calls, chats or spreadsheets: the data goes from the boundary straight to the dashboard.
This is the first version, built on our assumptions and taken to our first client. Each screen carries what we assumed above it, and what the users showed us below it.
Made before we had real users. The personas came from our assumptions. They are who we pictured when we designed Version 1.
Plantation, growth and survival caretaker
Role. Looks after the plantation, growth and survival of the trees in the forests assigned to him, and reports to the project team.
Forest officer
Role. A forest officer who already manages forests, each with a plantation target. He collects data against the planned and planted counts, species by species, and plans the next days’ work from them.
Then we met the real users. Here is that first version, and what they showed us.
1Colour for recall
We assumed
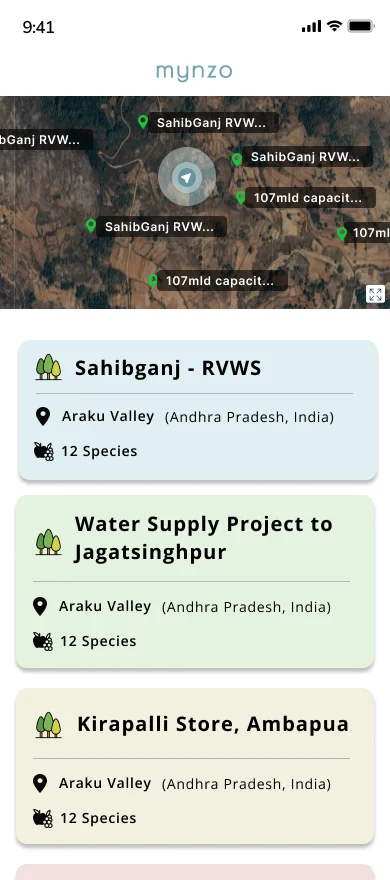
Each forest was given a colour for recall, assuming users were not very tech-savvy and might not follow English.
Users showed us
Users read and write well, mostly in their own language and some in English. They went by boundary names, not colours, so Version 2 drops the colour.
2Plantation first
We assumed
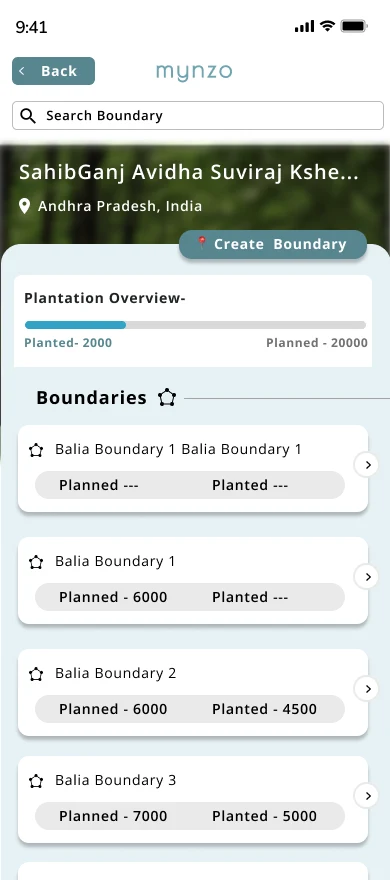
Plantation was the most important metric, so Planned and Planted led. We expected users to collect data against these counts and plan around them.
Users showed us
It is a business metric users do not need upfront. The count shows when a forest or a boundary is selected. Version 2 leaves it to the dashboard.
3Species next
We assumed
Plantation is split by species, so the species list came straight after the boundary.
Users showed us
Users are mostly foresters and experienced field people who know their species. For the rare exceptions, Version 2 adds (Other).
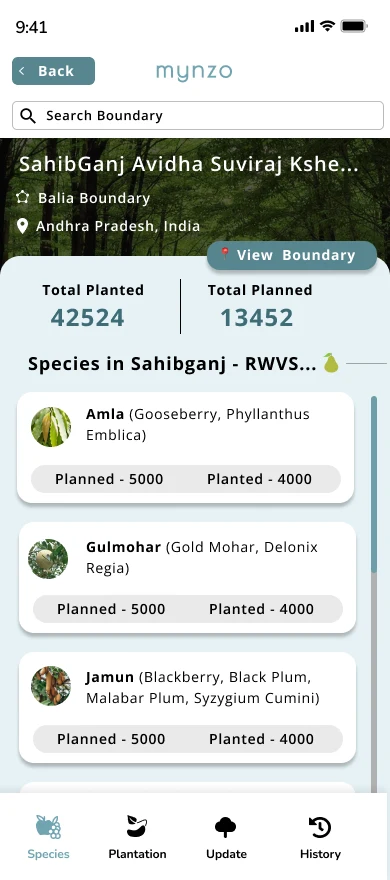
4Create Boundary
We assumed
Boundaries would be created beforehand on the dashboard, so the app needed only a small button for the exception.
Users showed us
Not a daily task, but also done on someone’s behalf, and a dashboard KML can differ from the field boundary. Users create and edit in the app, so Version 2 makes it a main job.
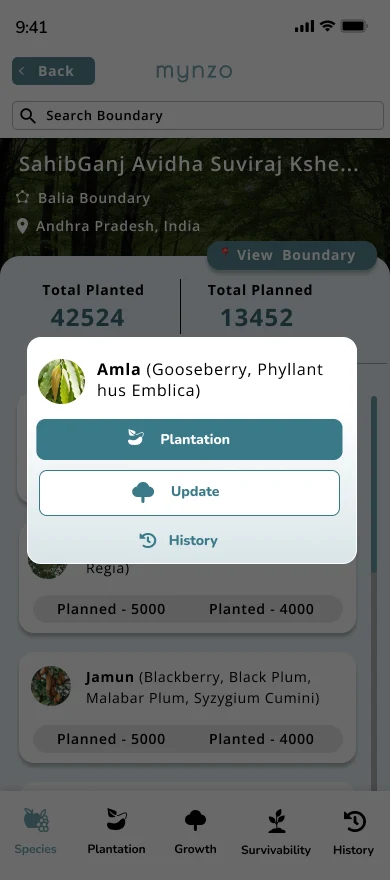
5The job came last
We assumed
After choosing a species, users picked Plantation or Update from a pop-up. The tab bar appeared only after a forest and a boundary were selected.
We realised
Too many steps came before the actual data collection. In the sun and weather of the field, users need to record quickly, so Version 2 cuts the steps.
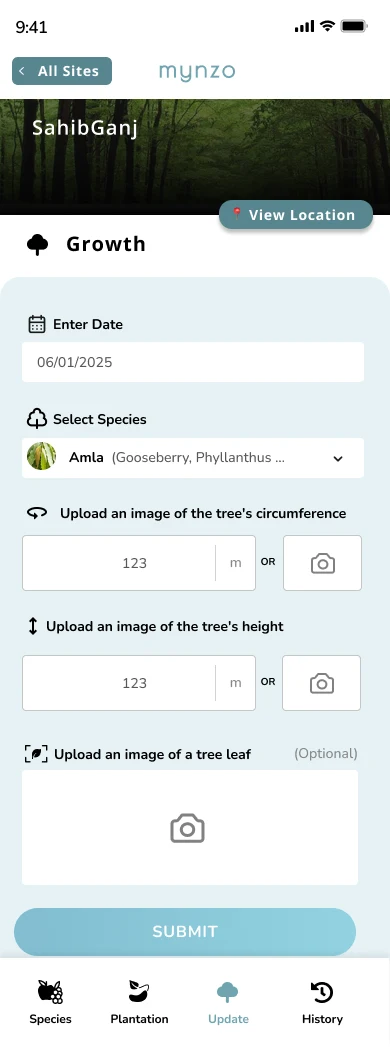
6Typed or camera
We assumed
Growth could be typed or captured by camera, as we were not sure which would work better.
We realised
Even after the photo was captured, users often typed a wrong value, as field conditions invite errors. Version 2 removes the typing.
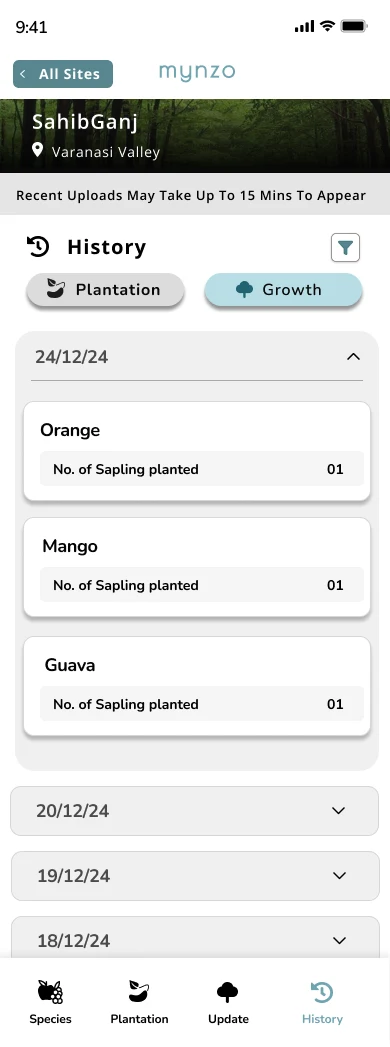
7One history
We assumed
A single cumulative history page would serve both plantation and growth.
We realised
The product would grow, with more tasks added. One history for all would limit it and clutter the view. Version 2 gives each task its own history.
What this means
Version 1 was the right first step.
After the field visit we understood what matters to users and what does not. Version 2 answers each of these seven points.
Built after the user study, this version answers each of the seven points marked on Version 1. It opens with the five jobs a partner does, placed for quick selection because one partner often does several in a day. Every screen keeps typing to a minimum, so collection is quick and the data is accurate.
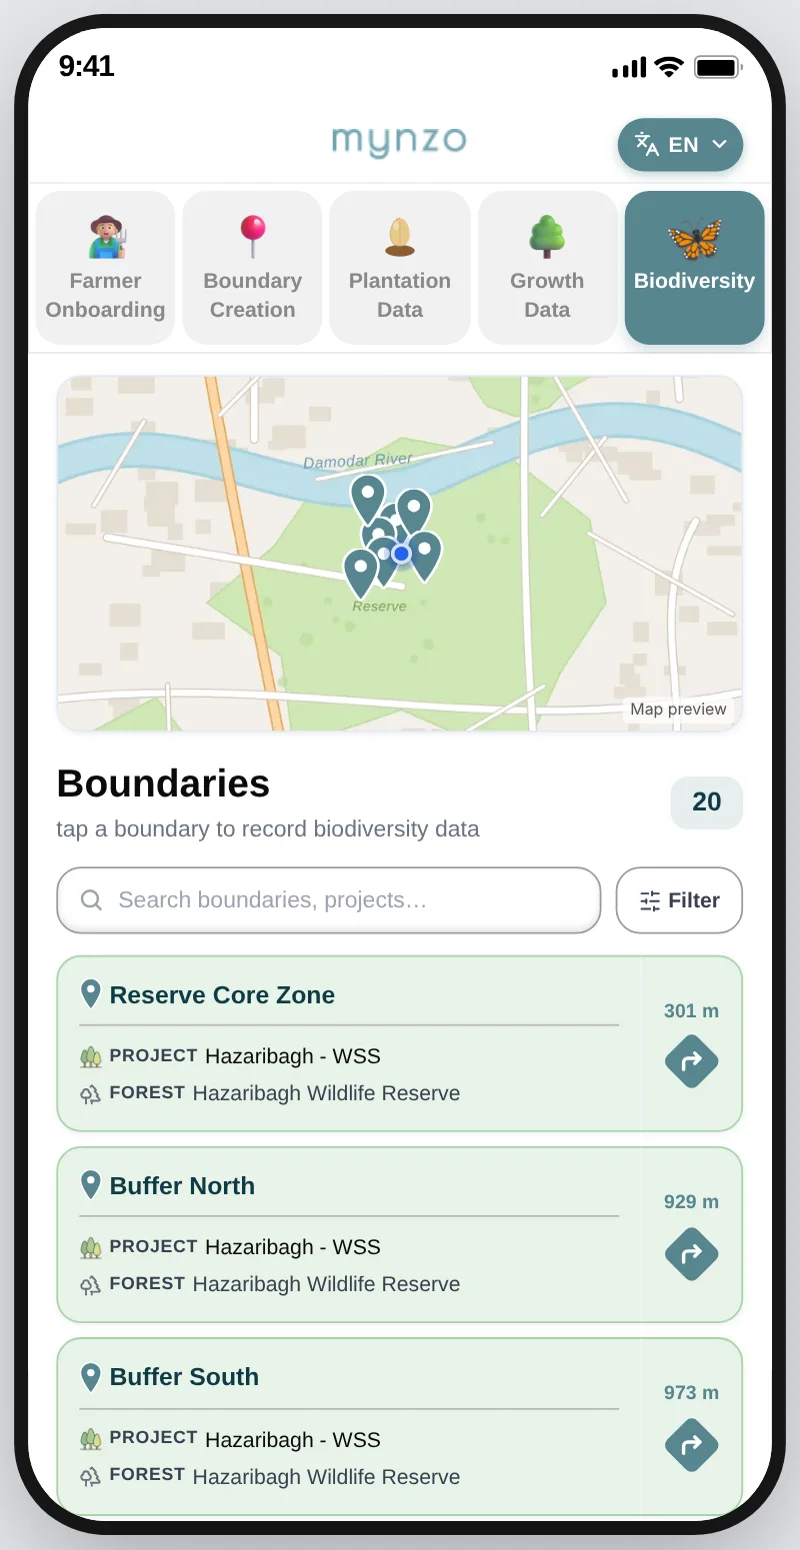
The five jobs sit as tabs at the top of the home screen, so a partner can move between them at once.
WhyOne partner does several of these jobs in a single day on the ground, so switching between them is the first thing on screen.
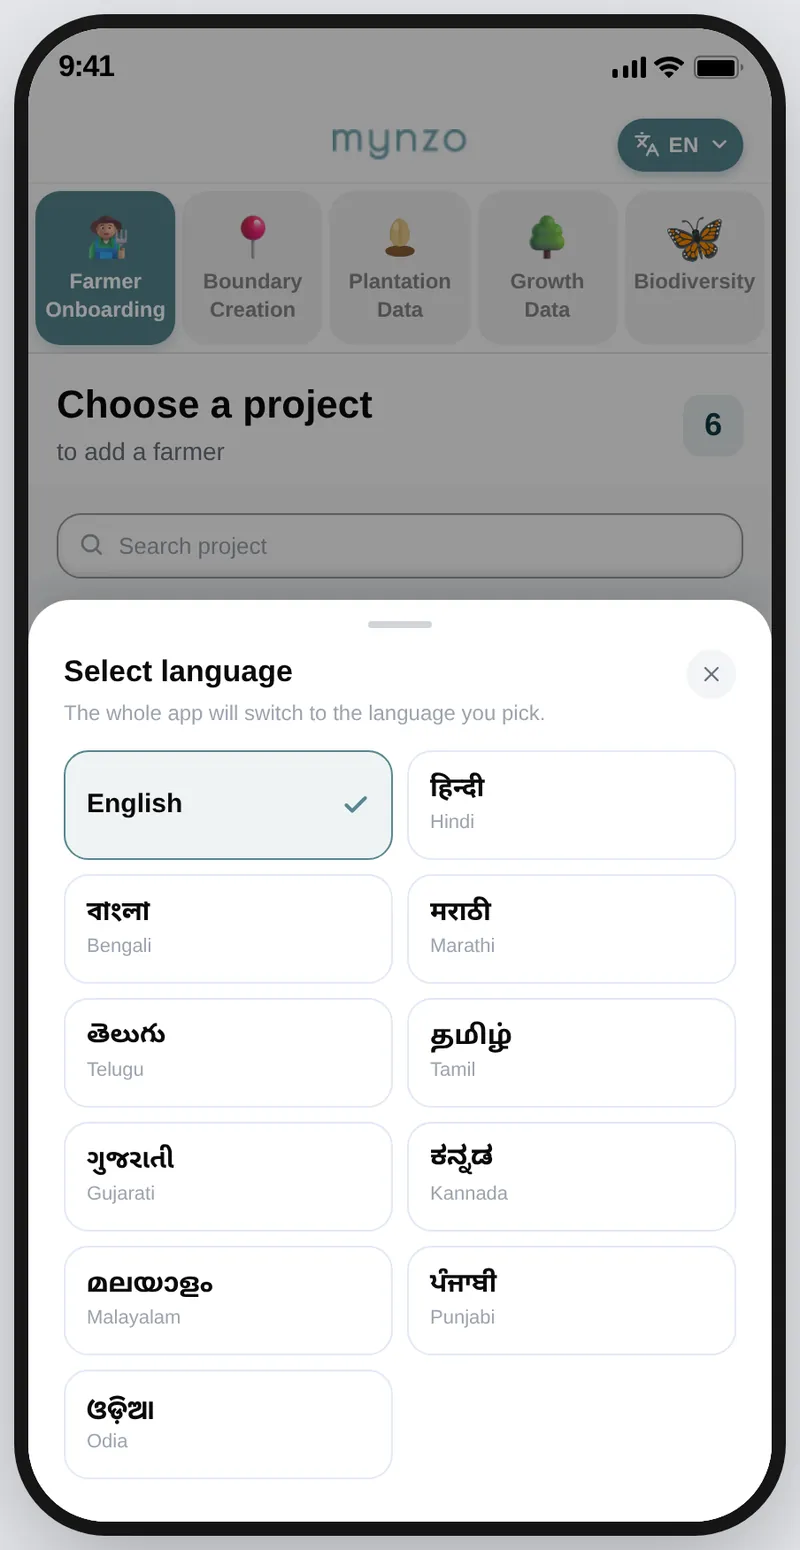
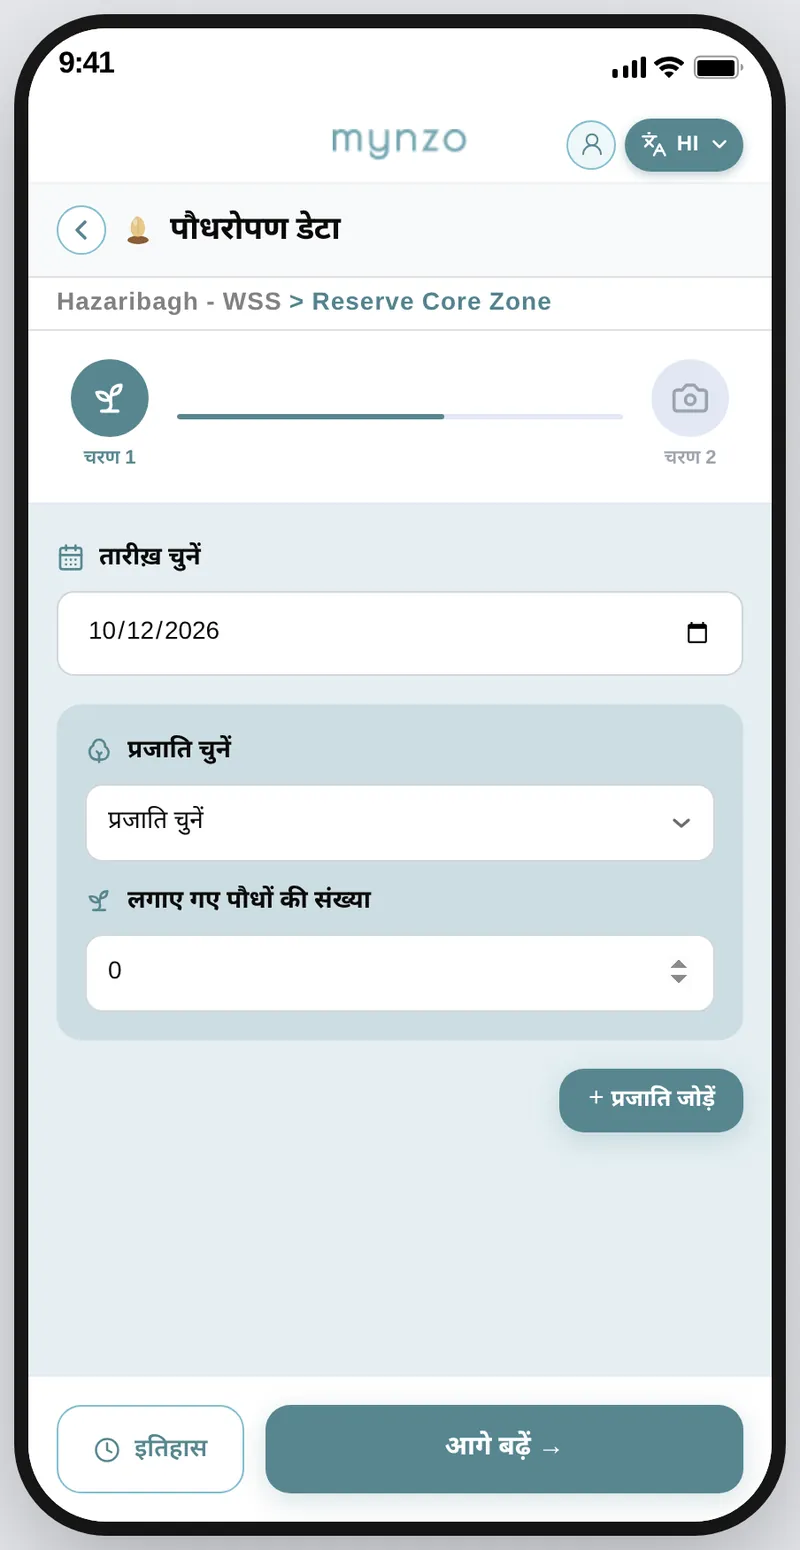
Partners work in the language they are most comfortable in, so nothing depends on reading English.
WhyEverything after this screen depends on being able to read it, so language comes first.
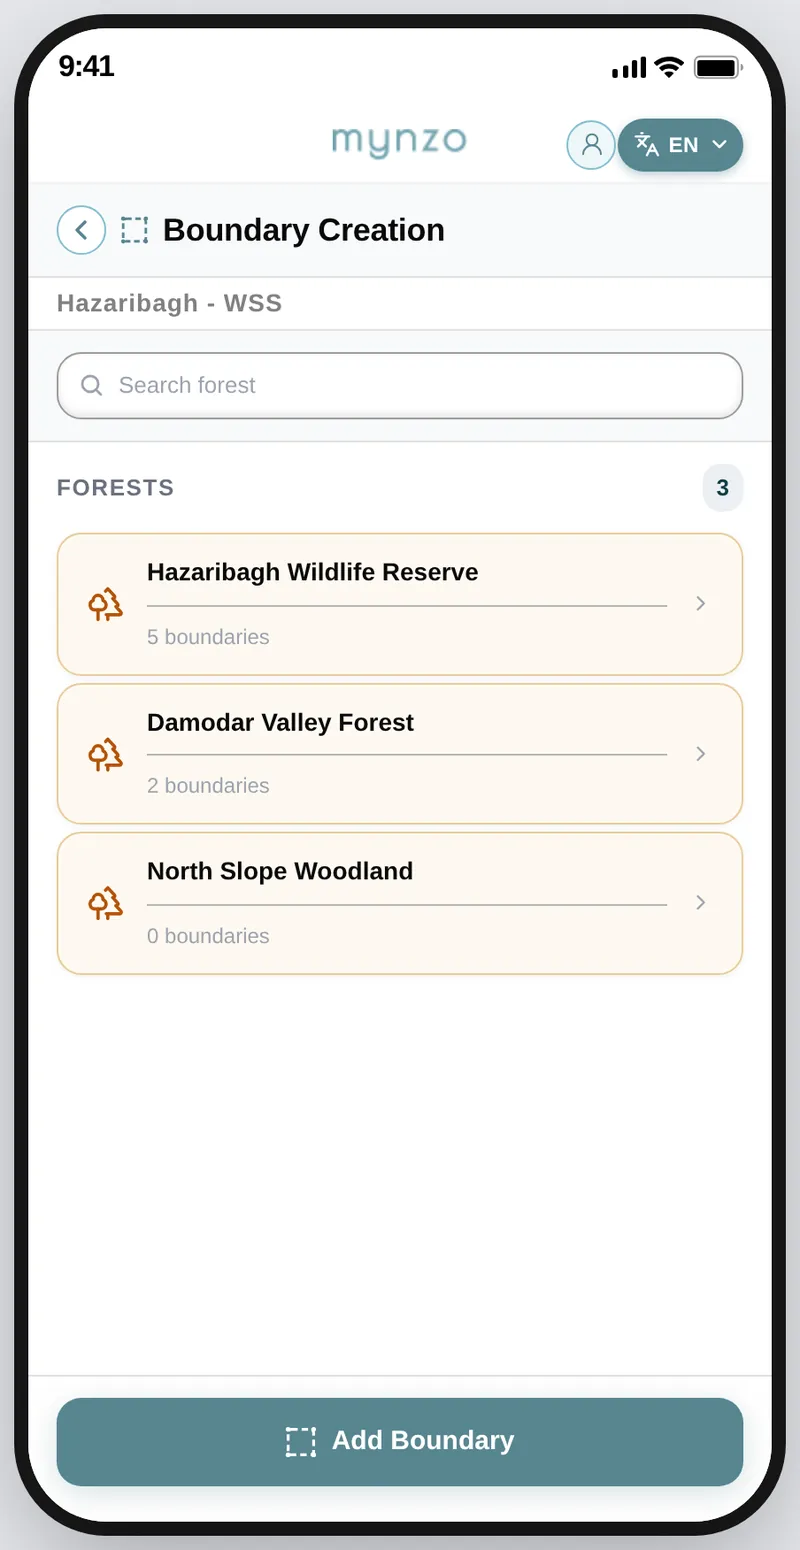
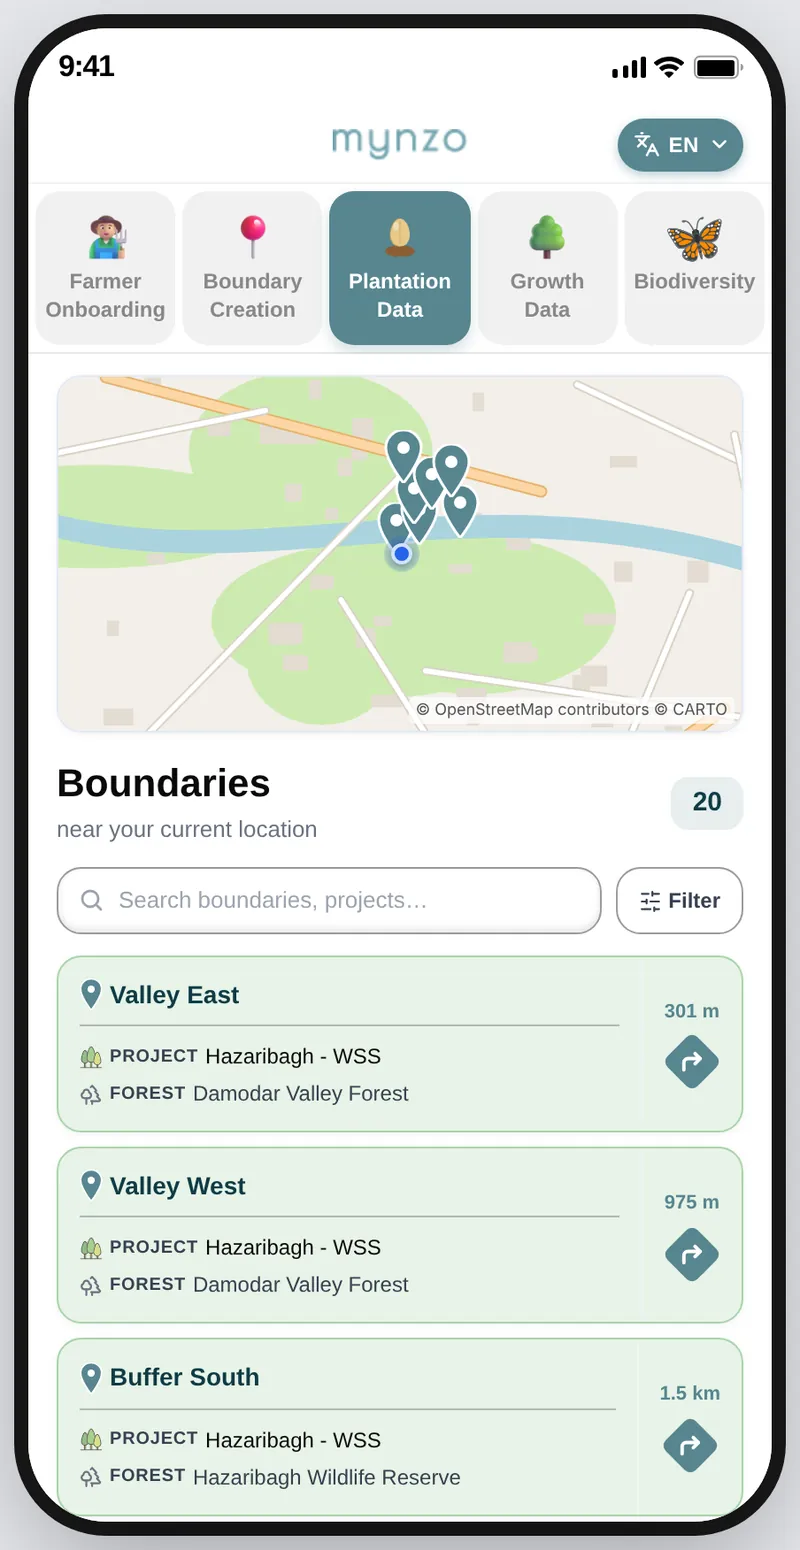
Each job opens on the information that matters for it.
WhyNo tap is spent on a level the job does not need.
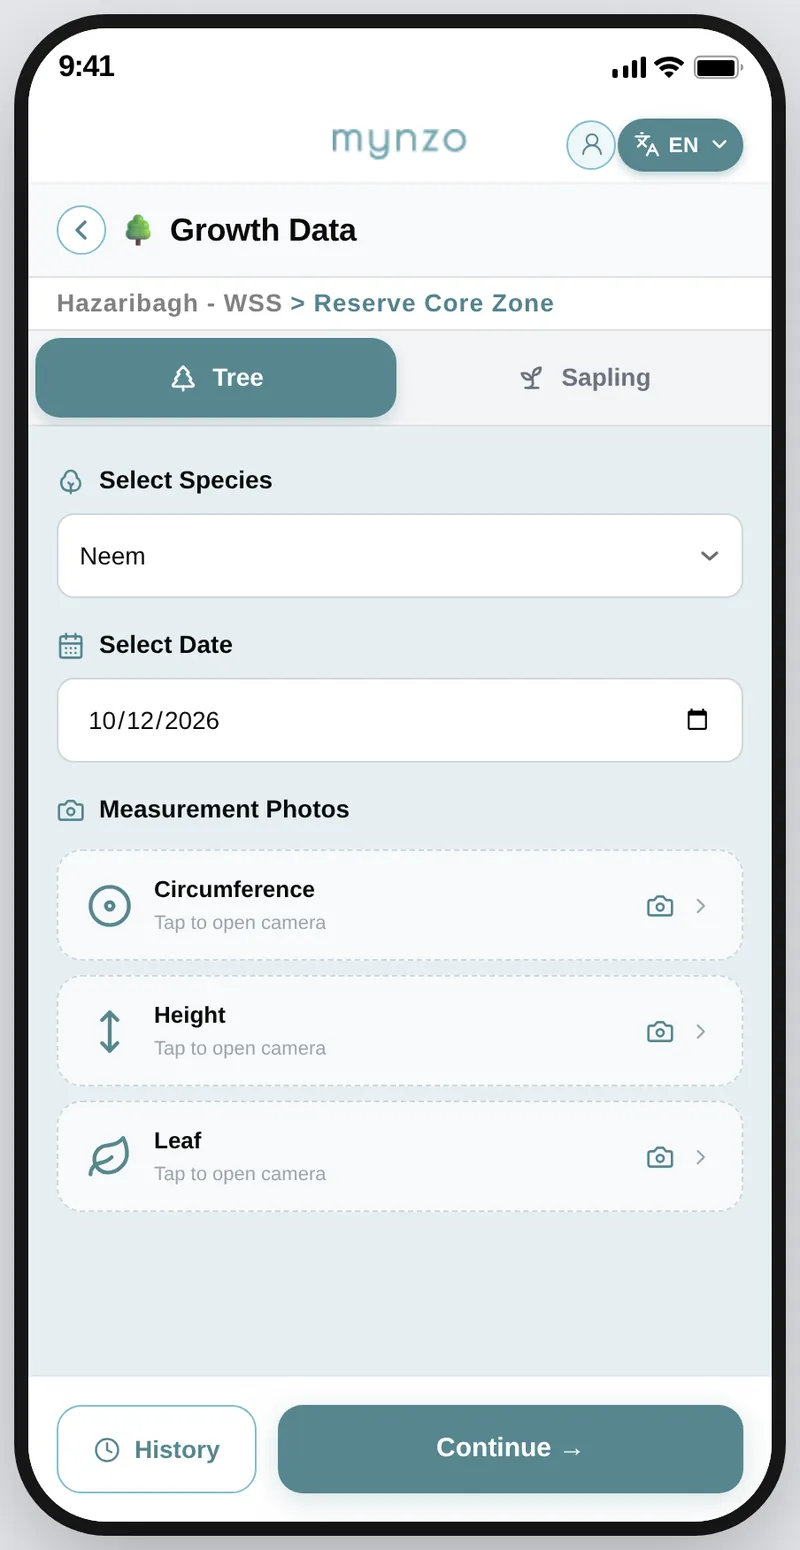
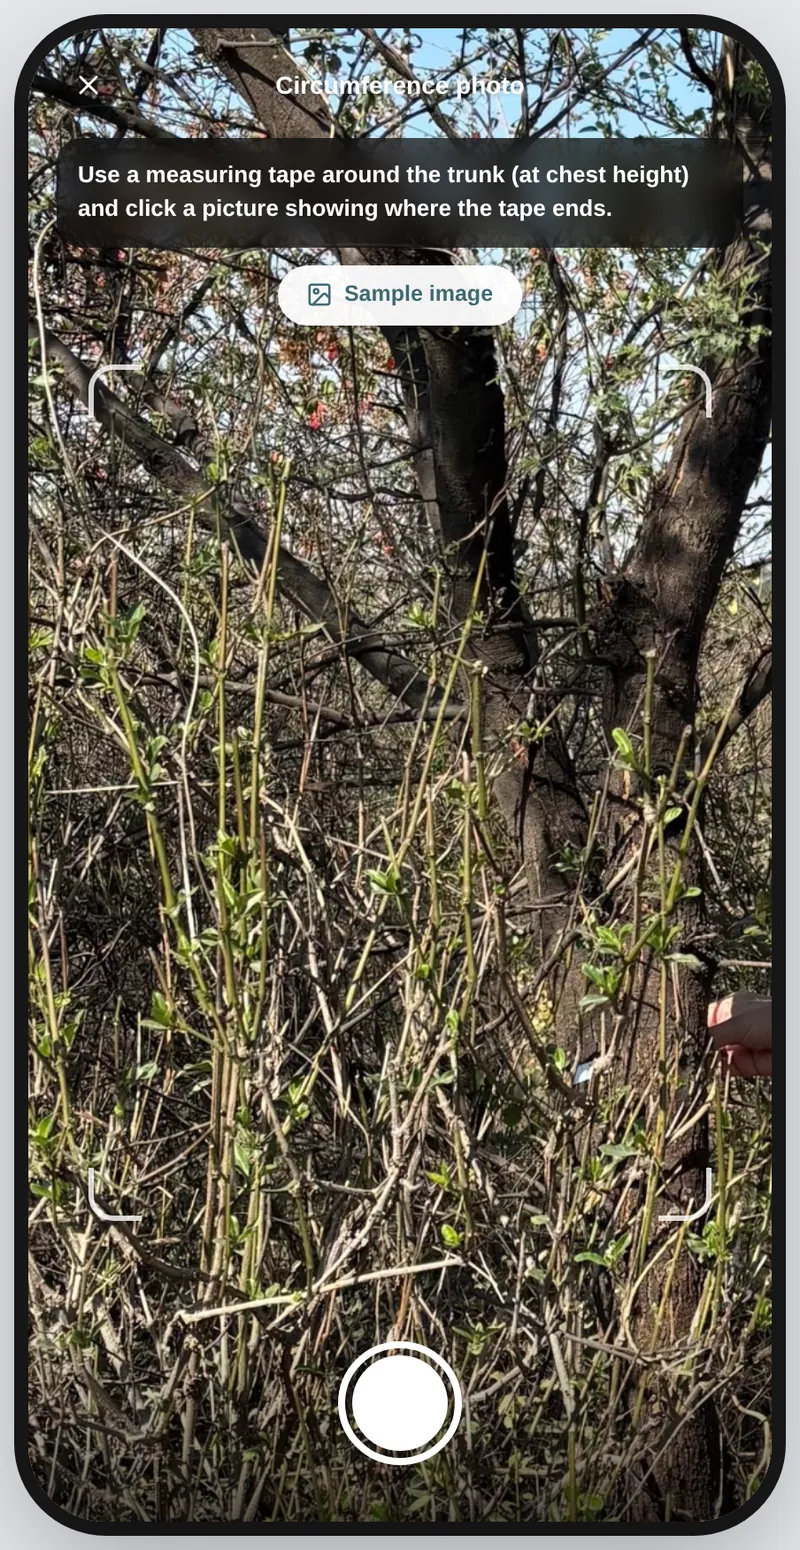
Inside a boundary, each growth measurement is a photo, and tapping one opens a camera that explains it.
WhyEach photo has a purpose. Circumference shows how much carbon the tree stores, height is calculated from the photo, and the leaf lets our model identify the species when a partner picks Other.
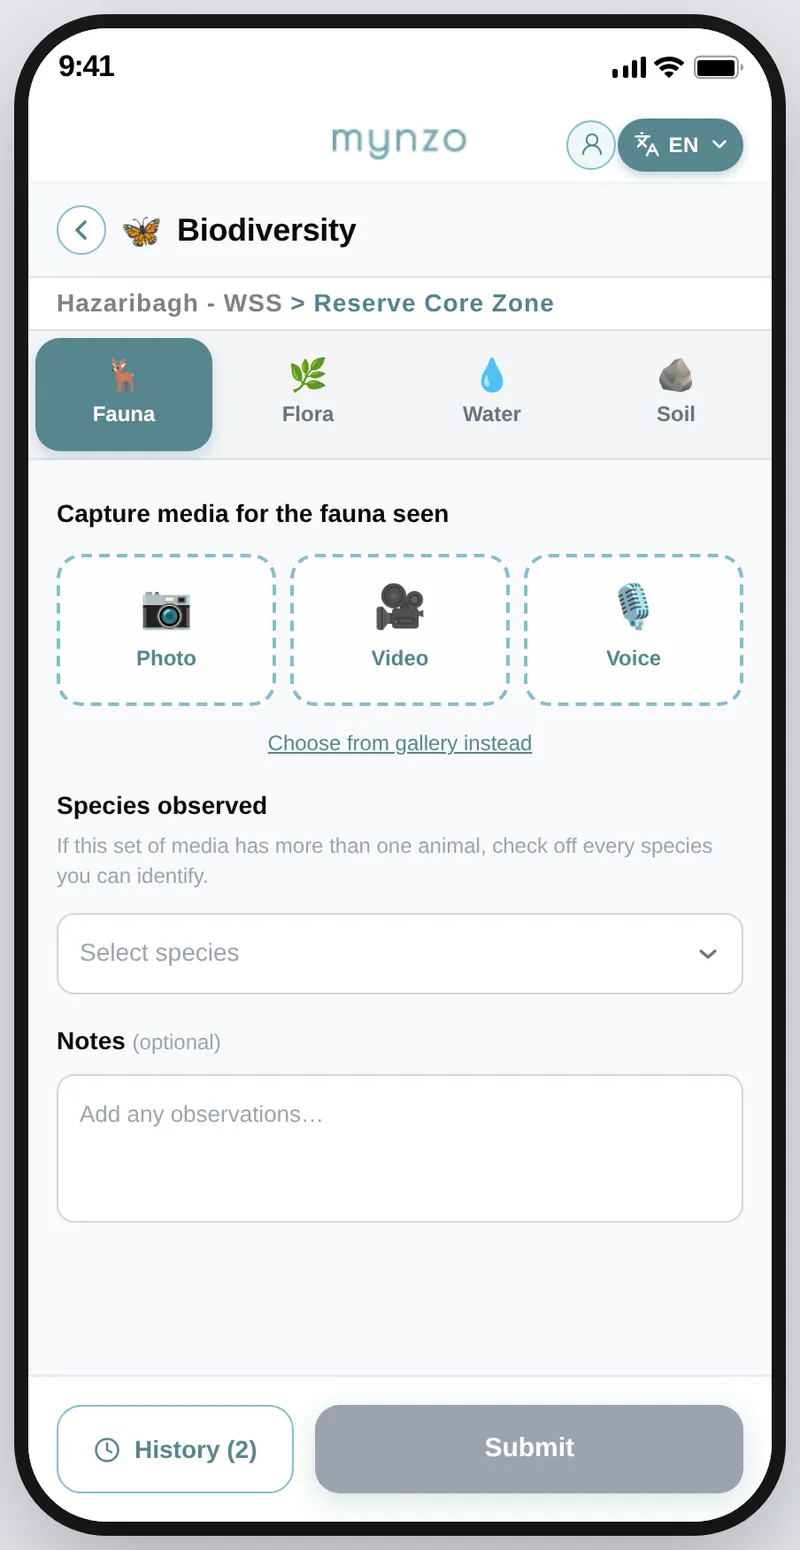
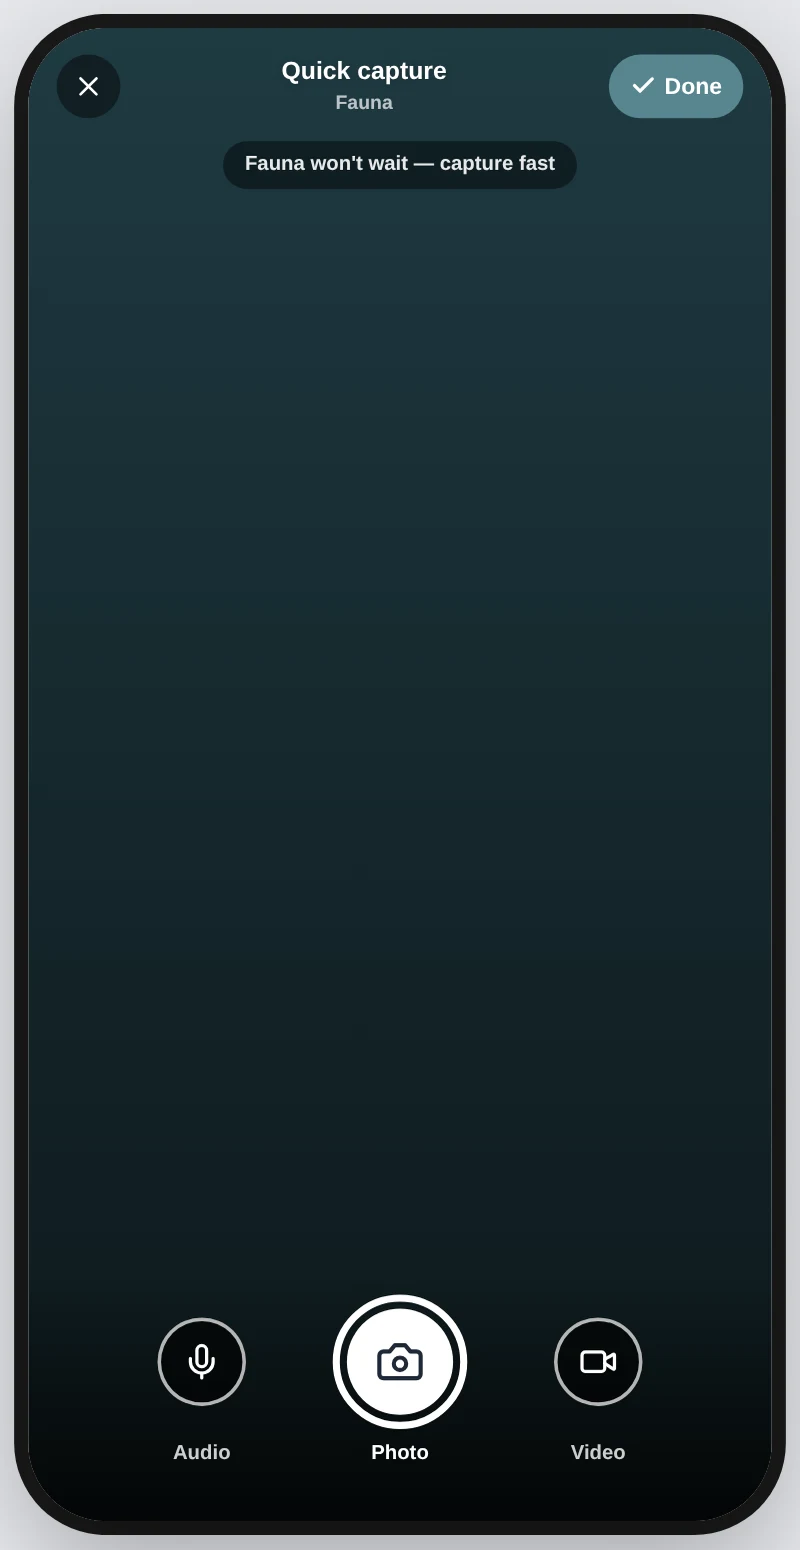
Animals and birds are gone in seconds, so capturing them has to be the quickest thing in the app.
WhyA missed sighting cannot be retaken, so nothing is allowed to slow the first tap.
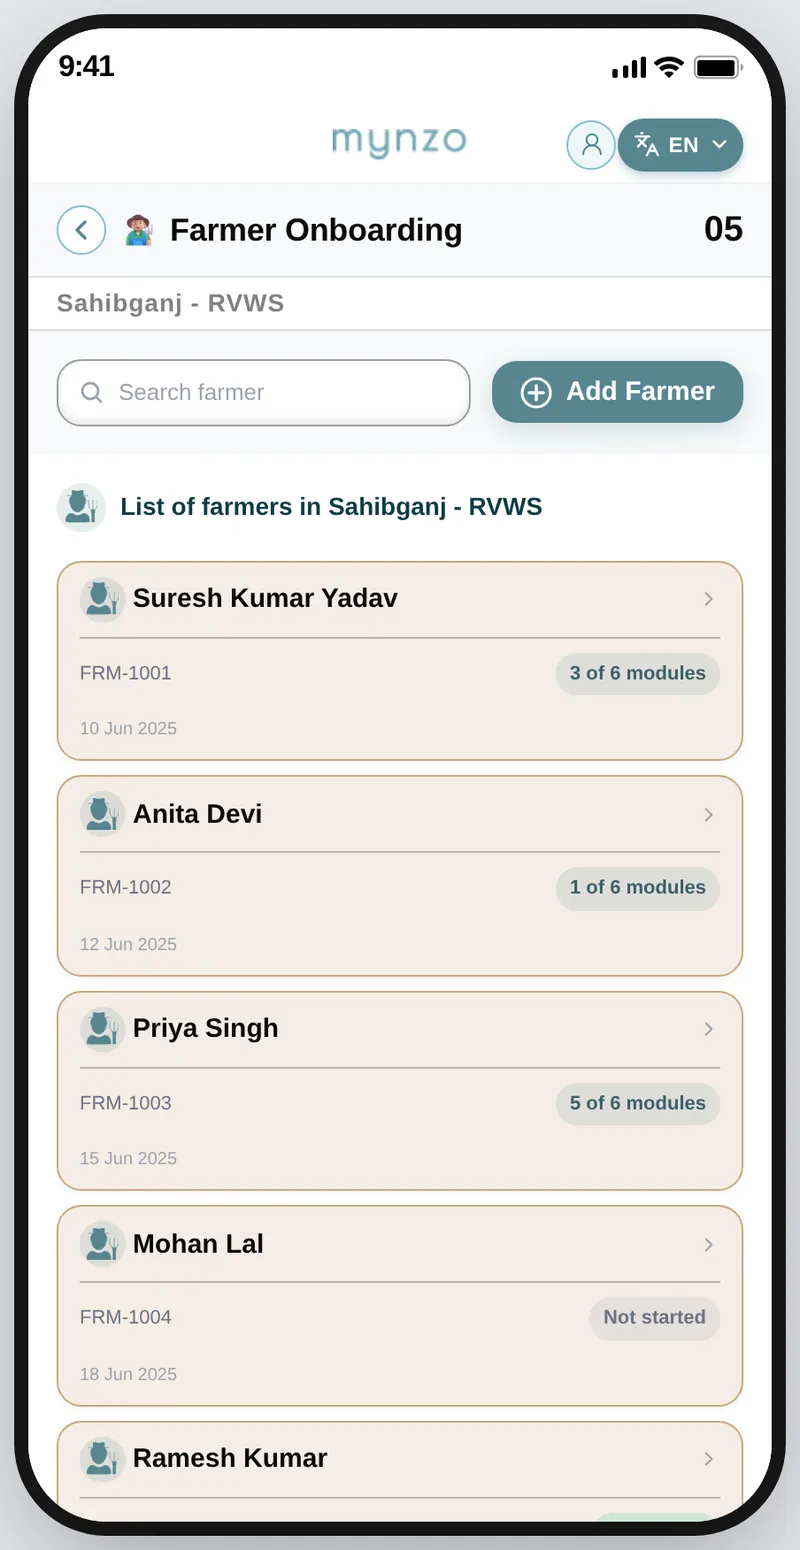
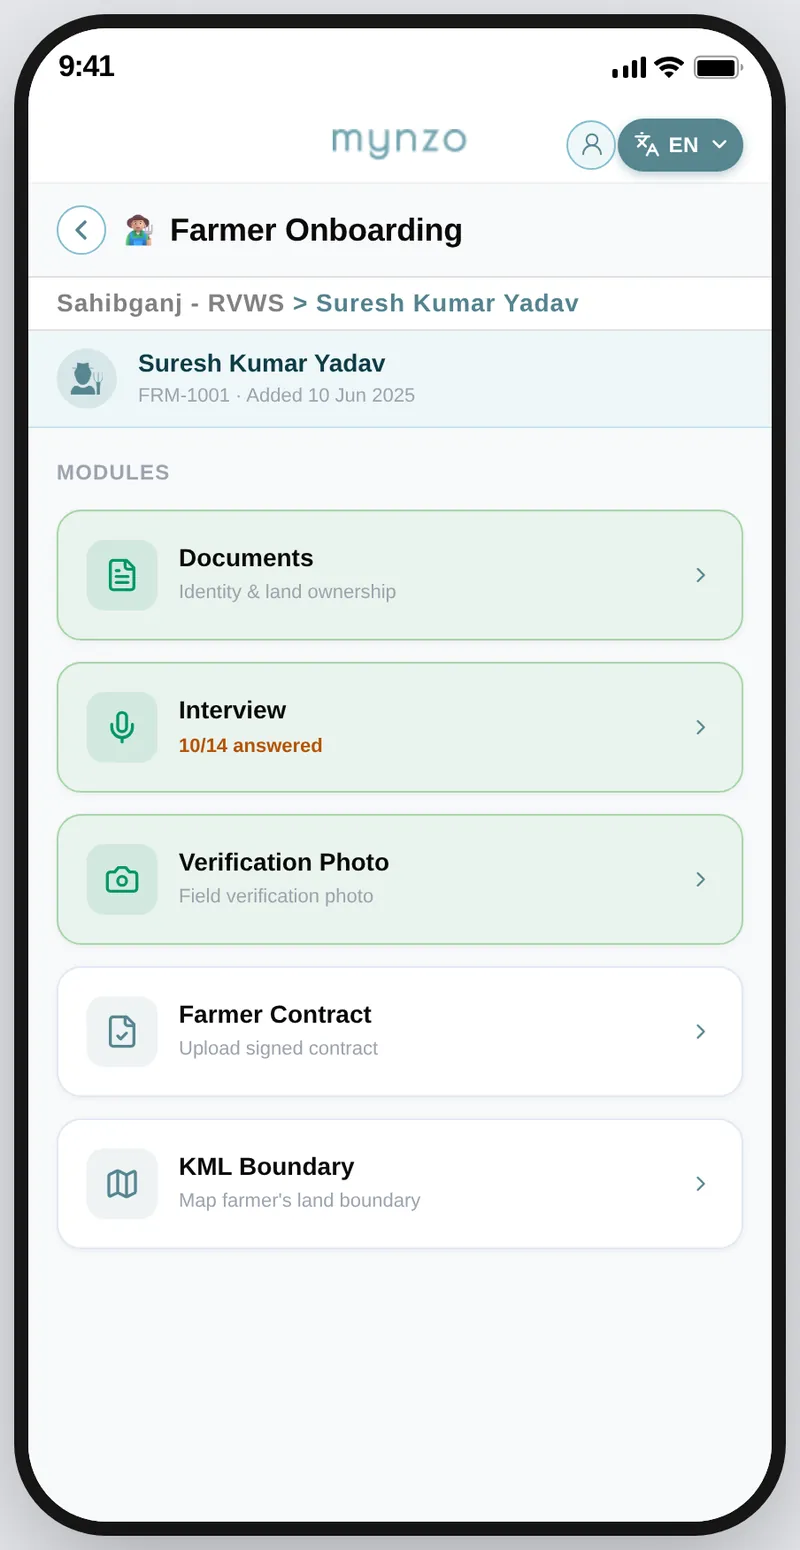
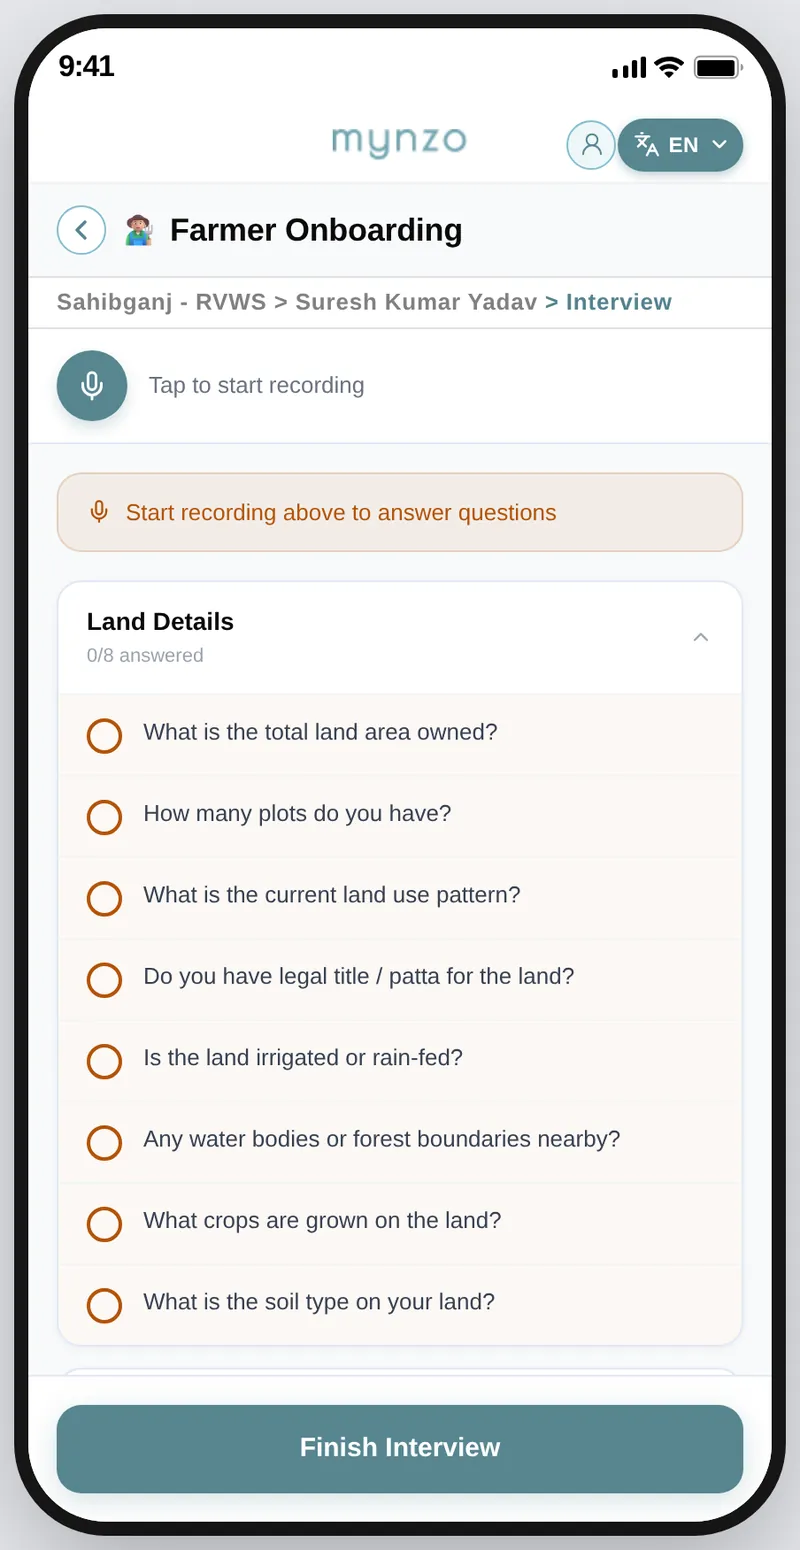
How a farmer is onboarded
When a project starts, the company visits farmers to take their land's carbon rights.
An interviewer first speaks to the farmer about the land: how it is, which species are grown and how it is doing. If everything goes well, the interviewer returns after a couple of days to get the contract signed, and the farmer is onboarded.
Everything needed to register a farmer is done in the app, from the interview to the contract.
WhyAn interview is a conversation, so the partner should be listening to the farmer, not writing.
Tap through it the way a partner would. The notes beside the phone follow you and explain the screen you are on.
Farmer Onboarding
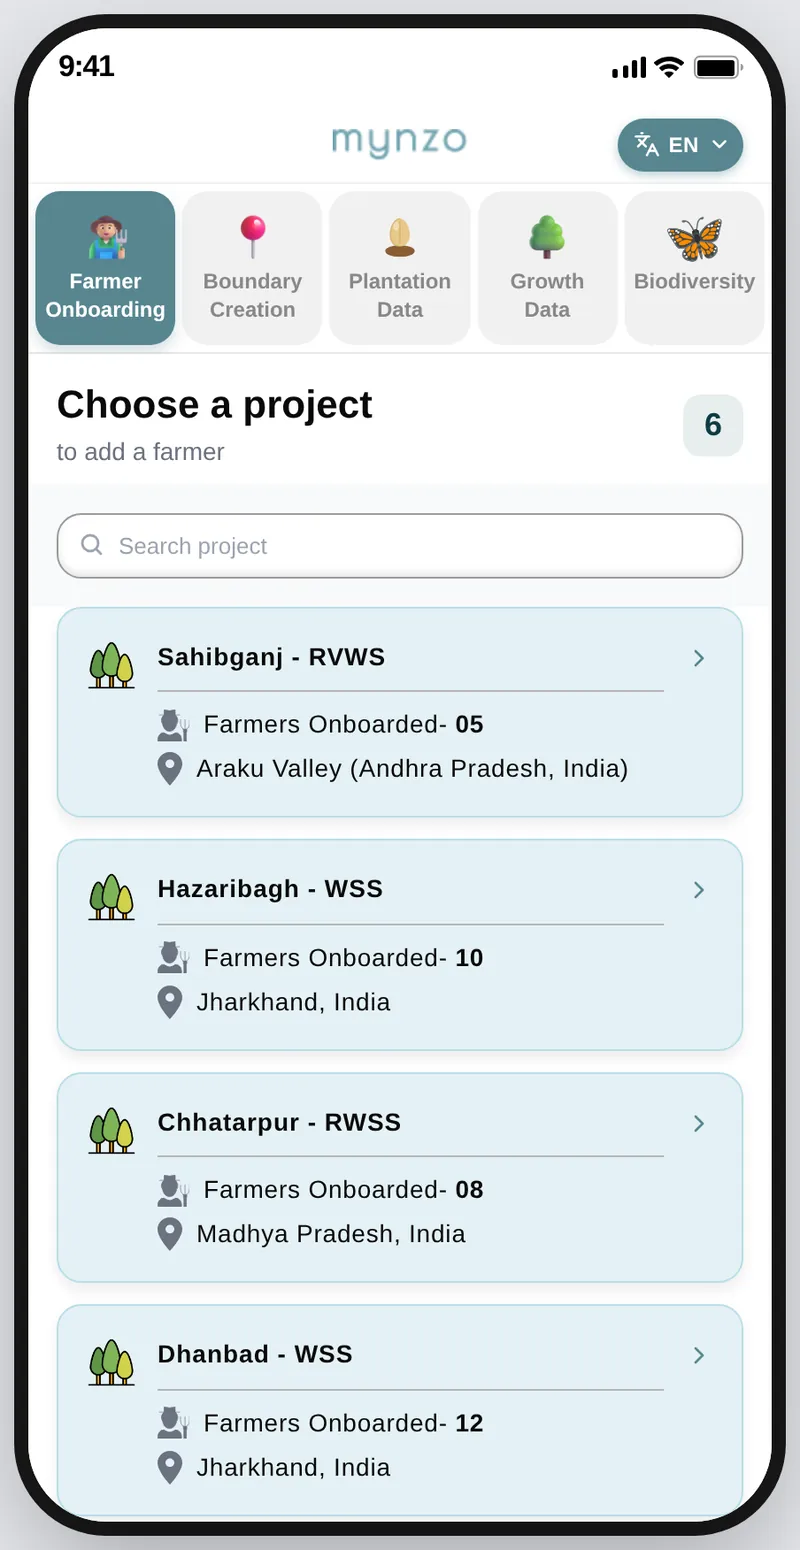
Farmer onboarding is the first step of a project. At this point only the project exists, created from the dashboard, so it is the only level shown. Forests and boundaries come later.
Saved on the phone. The red banner shows what is waiting to sync. Tap it to review.
Try Tap a project to see its farmers
Each decision had an obvious alternative. These six were decided together with the tech team and the product manager. Four of them come straight from what Version 1 taught us, and in each one speed in the field won over the familiar pattern.
I chose
Instead of
Opening on projects, then forests, then boundaries, the same way as farmer onboarding
Because
This data is collected at boundary level, so choosing a project and a forest first would be wasted taps in the field.
I chose
Instead of
Typed fields for circumference, height and leaf
Because
Manual entry caused most of the errors and was very time-consuming. Our in-house model can read the measurement from the photo, so nothing needs to be typed.
I chose
Instead of
Choosing the species before the camera opens
Because
A fauna sighting is over in seconds, so the camera has to open in one tap.
I chose
Instead of
Separate screens for each kind of capture
Because
The partner can switch mode in one tap without leaving the camera and missing the moment.
I chose
Instead of
A different colour for every forest, carried through all the pages, as in Version 1
Because
Users look for a boundary by its name, not by the colour of its forest, so the colour added little.
I chose
Instead of
Planned and Planted counts at the top of the app and on every boundary
Because
The count is a business metric. Users do not need it upfront in the field, so the space goes to what they do there.
Before the rollout, our team took the app into the forest and used it ourselves, capturing data tree by tree, to check that every photo step works outdoors. Then we rolled it out to partners.
Collection sped up once we rolled the app out to partners.
Before the app
25 to 30
data points collected in a day
With the new app
400
data points collected by two people in two days
That is about 200 data points a day for the pair, roughly 100 each.
The Partner App and the dashboard are live with clients across India and Southeast Asia.
The early result is a first sign. These five measures would give the full picture of whether the app does what it set out to do. The targets are proposed, and the measures themselves are yet to be tracked.
Collectors sorted photos into categories by hand, at home, after a long day.
None. Photos arrive already sorted, because each one is captured for a job.
Details were typed for every photo, and typos reached the data.
2 to 4% of entries need a correction, because our in-house model reads the measurement from the photo and nothing is typed.
Photos went through WhatsApp and were rebuilt in Excel before any report.
Same day as the partner syncs, with no rebuilding.
Work was assigned on calls, and collectors often did not know what to cover next.
30% more boundaries completed per collector per day than under the old process, which sets the baseline.
Labels and instructions in English slowed partners down and led to mistakes.
At least 8 in 10 partners finish a task unaided in their own language.
The biggest problems, like no signal, only showed up in the forest itself.
If the app works deep in the forest, with no signal and one charge for the whole day, it works everywhere.
A clear screen in the wrong language is not a clear screen.
Next: test the app with more partners in the field, track the five measures above, and compare them against the targets.