01
What Mynzo does
- Companies plant forests
to take carbon out of the air
- Mynzo looks after them
We monitor, measure and report what they achieve
Case studyClimate data platform
I designed the Mynzo Climate Dashboard end to end, from research to the front end: the live SaaS platform through which Mynzo delivers its services to clients, turning scattered field and satellite data into clear decisions.
Stage 1 of 5
The problemWhere we started, and what went wrong for clients.
01
to take carbon out of the air
We monitor, measure and report what they achieve
02
Our mobile app collects data on how each tree is growing.
We run satellite analysis with our in-house AI models.
We generate reports that show the results.
03
Think of a school
We had no users yet, so we shipped a first version early.
Real clients started using it, and we began watching how.
Talked to users about what they needed and how they work.
Four problems showed up in the MVP.
Set what it needs and how it should work.
New screens, built and released to clients.
We shipped an MVP early so clients could see their forests quickly. Once real clients were using it, I studied how they worked with it.
Too many clicks and too much to take in before anyone reached what they came for.
In the MVPNew users needed a walkthrough from our team to find their own forest.
How I solved thisThe dashboard only showed numbers, so the decision was left to clients.
In the MVPSurvivability showed 87.2%, but nothing said whether that was good or bad.
How I solved thisEvery new client added projects, forests and boundaries to one crowded screen.
In the MVPLong lists and tables, with nothing to say where to look first.
How I solved thisOur team made reports by hand, trained every new user and answered questions about the numbers.
In the MVPReports were files our team made and sent over, one by one.
How I solved thisHow might we turn complex climate data into clear answers users can act on02, showing each person what matters to them03, on one platform that clients can use on their own01 and that scales as new clients join04?
I owned the experience from the first research session to launch, and built the entire front end myself.
I interviewed real users from client teams about the platform, to understand their role in the company, the tasks they do, the decisions they take, their goals and their pain points.
What I owned
Who I worked with
Who uses the platform, and what do they need?
Interviews · Information priority · Findings · User journey · Access control
Jump to section →How do people move through it?
Journey mapping · Findings · Decisions
Jump to section →What do users see and do?
One template · Monitoring · Live demo
Jump to section →How did it go live?
Front end · Hand-off · Release
Jump to section →Stage 2 of 5
Understand the usersTalk to the people who use it, and learn what each role needs.
I interviewed the users myself, one on one, to understand their role, their goals, their needs and the tasks they come to the dashboard to do.
Where do we stand, and what can I report?
What they assumeLeadership asks "where do we stand?", not "how many trees did we plant?"
Where is each project, and who is responsible?
What they assume"I don't need the data. I need to know someone is doing their job."
What data is still pending?
What they assume"If it's not done, whom do I call?"
Can I trust this data?
What they assume"My job is to verify the outputs, not to consume them."
After studying each persona, their tasks and the actions they take, I listed the information each of them needs, and marked how important it is to each person: primary, secondary or tertiary.
| Information | Sustainability head | Super admin | Field ops manager | Auditor |
|---|---|---|---|---|
| Where are we? | ||||
| Current project stage | ||||
| Ground data collection status | ||||
| Reports available | ||||
| Latest project updates | ||||
| Who owns this? | ||||
| Total projects | ||||
| Total forests | ||||
| Total boundaries | ||||
| Project assignment | ||||
| Assigned field ops manager | ||||
| Can this be verified? | ||||
| Tree-level ground data | ||||
| Satellite images | ||||
| What did we achieve? | ||||
| Survivability | ||||
| Sequestration | ||||
| Trees planted | ||||
| Saplings assessed | ||||
Platform owner Goal: Every project has an owner and keeps moving
Needs to seeWho owns what, what stage each project is in, the latest activity, the audit trail
EHSO Goal: Get every forest's data collected, on schedule
Needs to seeThe stage of each forest, what data is pending, and who is responsible
ESG head Goal: Know where every project stands, and share it with confidence
Needs to seeStatus, progress, alerts and ready reports
Independent verifier Goal: Verify the results before they are reported
Needs to seeEvidence, the audit trail and completeness
Every role comes to the dashboard to know how each project is doing and which stage it has reached. The dashboard didn't show this anywhere.
So: Status became the first thing on every screen. Users first ask "is everything fine?", and only then "if not, why?", so the reasons sit one click away.
Each type of user needs to see and do different things on the platform.
So: I designed the whole access system around roles. A new user is simply given a role, with no setup for each person.
One flow runs across all the roles. Each person picks up where the last one left off.
A person gets a role, and the role decides what they can see and do. I listed every function on the platform, grouped them into seven areas, and gave each one an owner and a reason.
No user is ever deleted. A user is only deactivated, so the work they contributed stays on record for audits.
Stage 3 of 5
Decide how the platform worksTurn what we learned into the rules the platform runs on.
I followed each user's journey: the steps they take on the dashboard to reach an answer and make a decision. Then I drew it out. The overview is the first thing everyone sees; each project opens from it.
Project status related
Overall
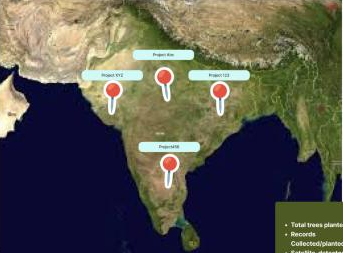
A version I tried first
What I chose instead
Zoom in
★ What we settled on
Project A
Overall
Project A status
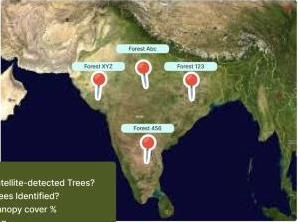
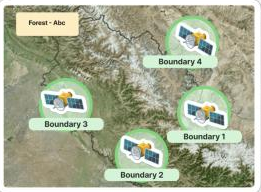
Project A status
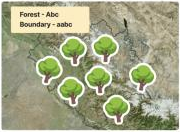
🌳 🌱 🛰️ 🥜
Zoom in
Zoom in
Tap
Zoom in
Findings and decisions
What I found
Users asked for status. What they didn't know was that they needed on track and off track.
What I decided
I introduced on track and off track. If even one boundary is off track, the whole forest is off track, so a delay is never averaged away.
See it in the productWhat I found
The data is complex, and this was new software for our users.
What I decided
The map works like Google Maps and reveals more as you zoom in. Detailed data works like an Excel sheet.
See it in the productWhat I found
Monitoring is where users decide. The detail they need to act lives on other screens.
What I decided
I kept monitoring light and linked it to the rest of the dashboard. The super admin sees a project is off track, taps its manager, and opens the access page. There she finds why: 500 of the expected 1,200 tree samples are collected.
What I found
The old dashboard let users select any mix of projects, forests or boundaries. No client needs to see two unrelated projects together.
What I decided
I removed multi-selection. Every view follows the grouping that already exists: project, forest, boundary.
What I found
Users need help in different ways: reports, quick answers about their data, or getting in touch with our team.
What I decided
Reni, our AI assistant, helps with all of it: it generates reports, answers anything about the data, and connects clients with the Mynzo team. If a client ever needs a metric across projects, Reni handles it.
See Reni in the productWhat I found
Some clients go straight from project to boundary, with no forests in between.
What I decided
I proposed allowing two levels. The team kept three because of the backend, so I designed a zoom from project straight to boundary.
What I found
Every client collects data on their own schedule: yearly, quarterly or once in two years.
What I decided
The filter shows only the years we have data for. If a client has data for 2023 and 2026, those are the two options.
See it in the productWhat I found
My board had a recent updates panel. But users first check on track or off track, and only then look deeper.
What I decided
I kept it off the monitoring screen, so the first step stays clear.
Stage 4 of 5
Design the screensGive every decision a screen that clients can read at a glance.
Monitoring is where clients spend most of their time. Every project has forests, and every forest is split into mapped plots called boundaries. Three reasons made the map the centre of it.
Everyone has used Google Maps. Zooming from a country to a street is a pattern they already know, so moving from a project to a boundary needs no training.
Every new client adds more projects, forests and boundaries. A table of all of them is unreadable; a map holds everything and lets users look closer only where they need to.
Field data is collected inside a boundary. Showing it on the map tells users not just what is happening, but where.
Scroll on and the dashboard opens full screen. Every view carries the reason behind it.
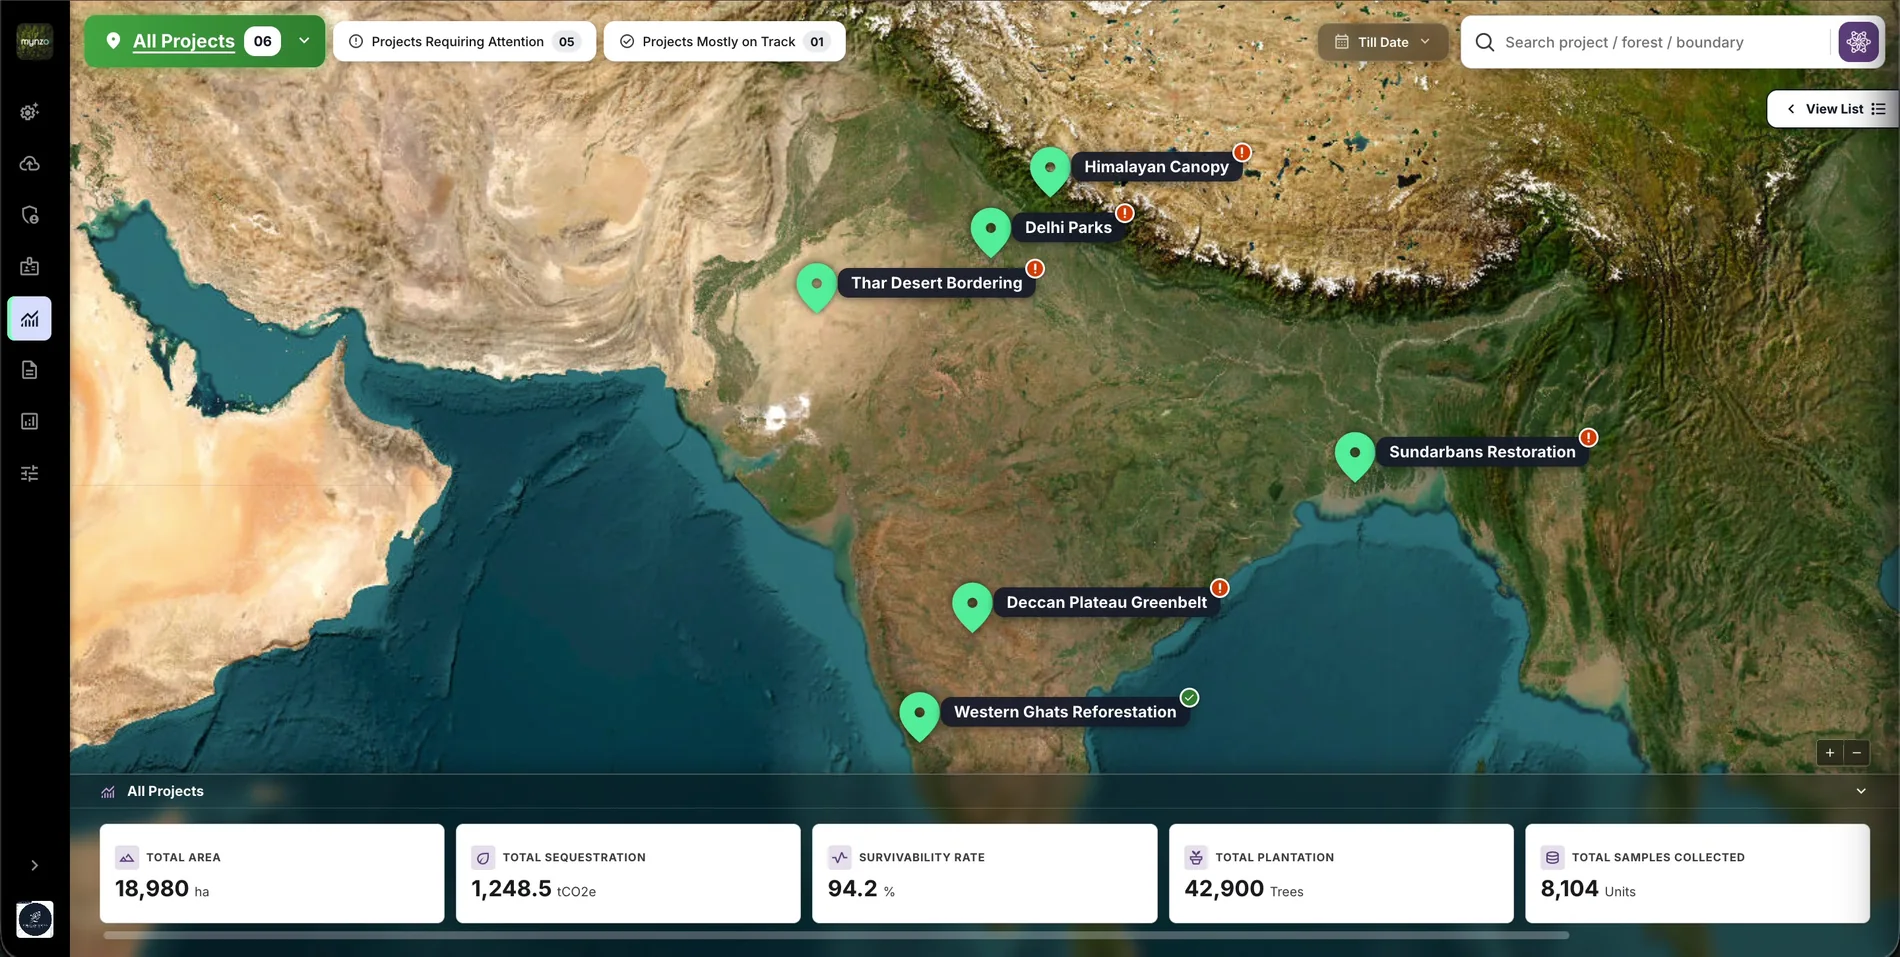
Mynzo Climate Dashboard
Walkthrough
Scroll through the live product. Each ?Why on a screen opens the reason behind that decision.
01 / 09 · All projects
WhyEvery user opens the dashboard with the same first question. So the overview answers it with status, before any number. Finding: status didn't exist ↑
Status comes first. On track or off track is what every user looks for, so the counts sit at the top and filter the map in one tap.A problem shows without a click. Every project carries its status on the map, so nobody has to open a project to find out.For convenience. Users can search any boundary directly, without first choosing a project and a forest.Clients collect data on their own schedule. The date filter offers only the years that actually have data.Results follow status. Area, carbon and survivability are the outcome of all the work, so they sit below the map, not above it.02 / 09 · Project
WhyGrouping follows the structure clients already work in: project, forest, boundary. No random mix of places, so every number on screen belongs together. Decision: no random grouping ↑
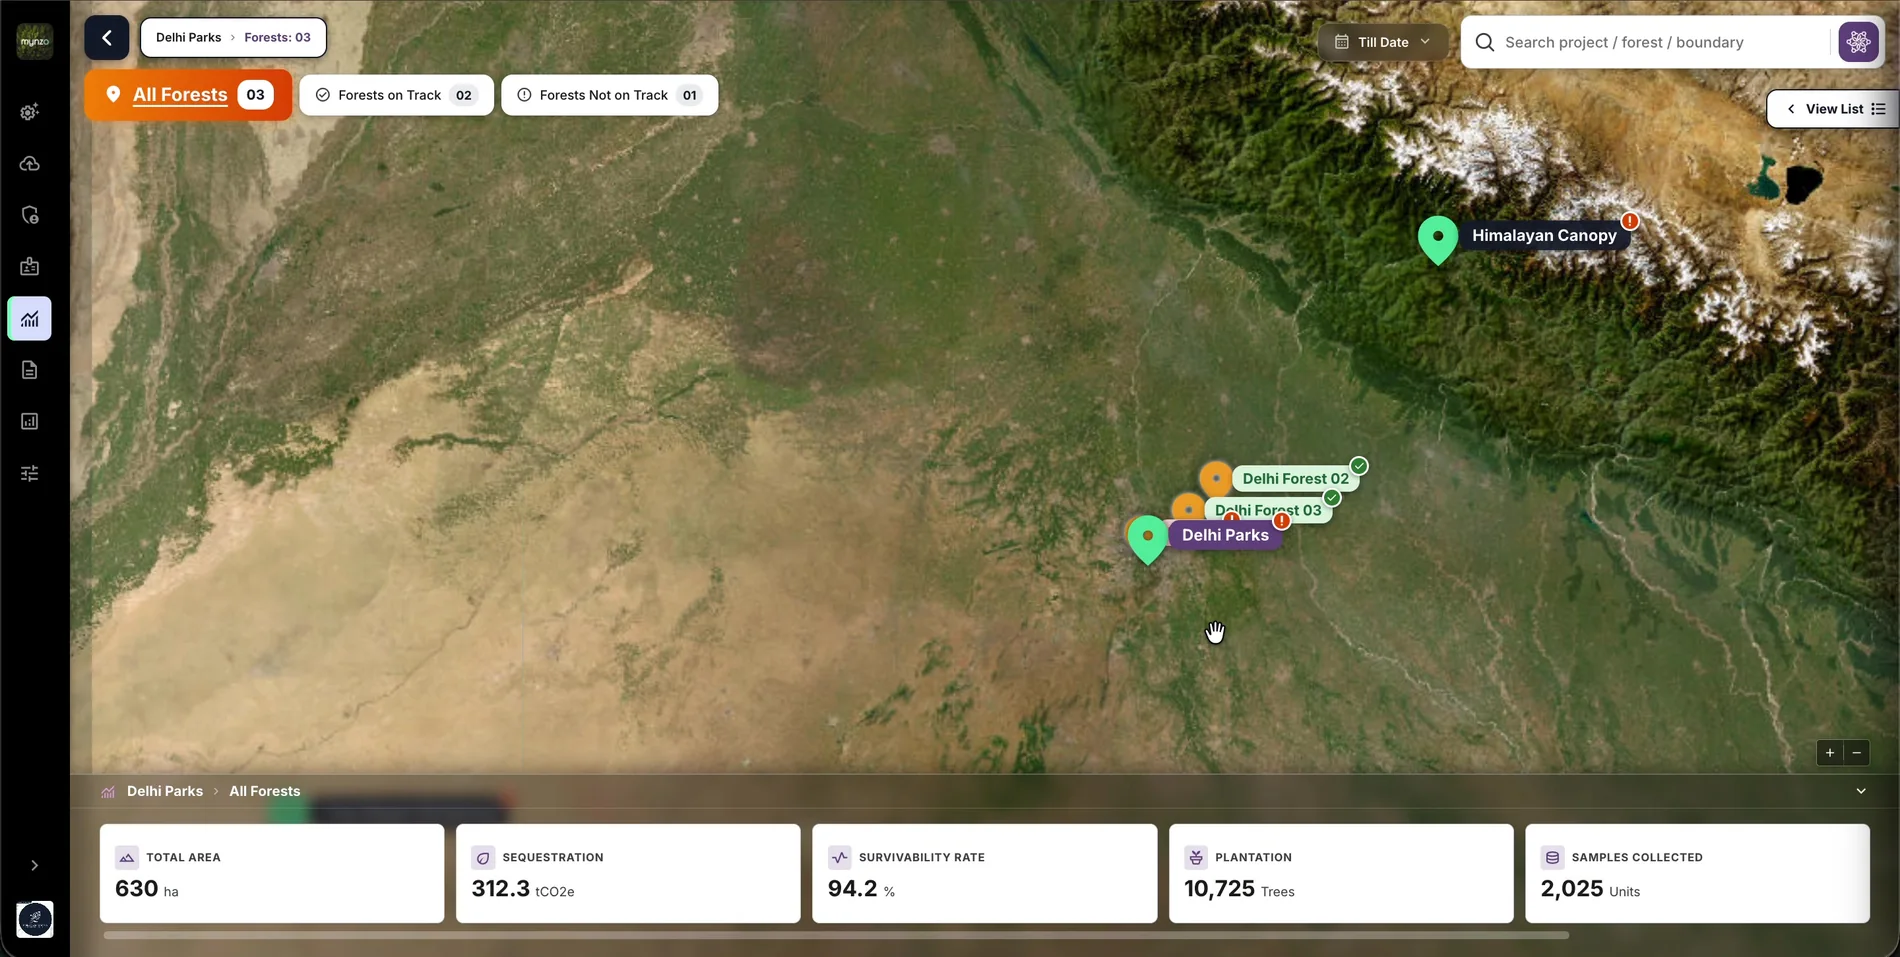 The same question, one level down. Forests on track and not on track let users follow a problem to where it is.Only this project's forests. The map shows nothing from other projects, so there is nothing to mix up.Numbers follow the map. The totals change to this project, so what users read always matches what they see.
03 / 09 · Forest
WhyIf even one boundary is off track, the whole forest is off track. A problem in one plot can't hide inside a good average. Decision: on track or off track ↑
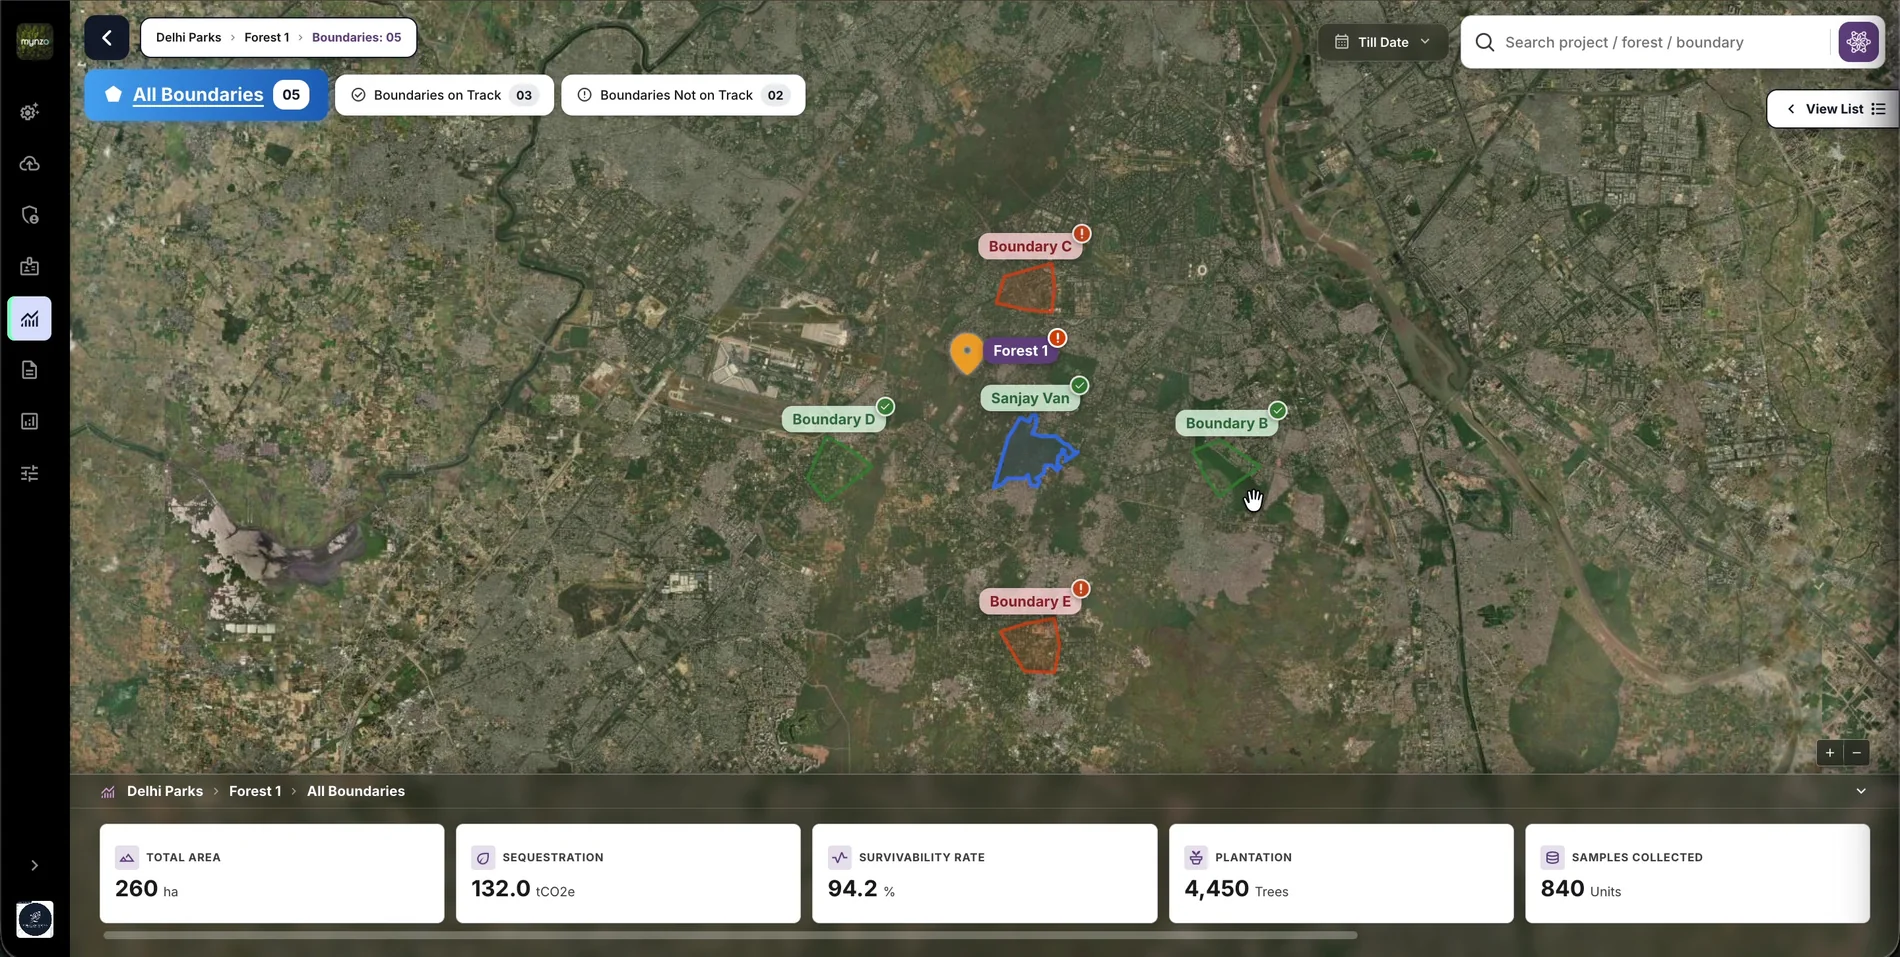 Off track stands out. Off-track boundaries are red and flagged, so the eye goes to them first.On track is marked too, with a tick, so status never depends on colour alone.Counts before detail. Users see how many boundaries need attention before they look at any one of them.
04 / 09 · Boundary
WhyEvery number is collected inside a boundary. So this is where all the data comes together, as layers on one map. Research: information priority ↑
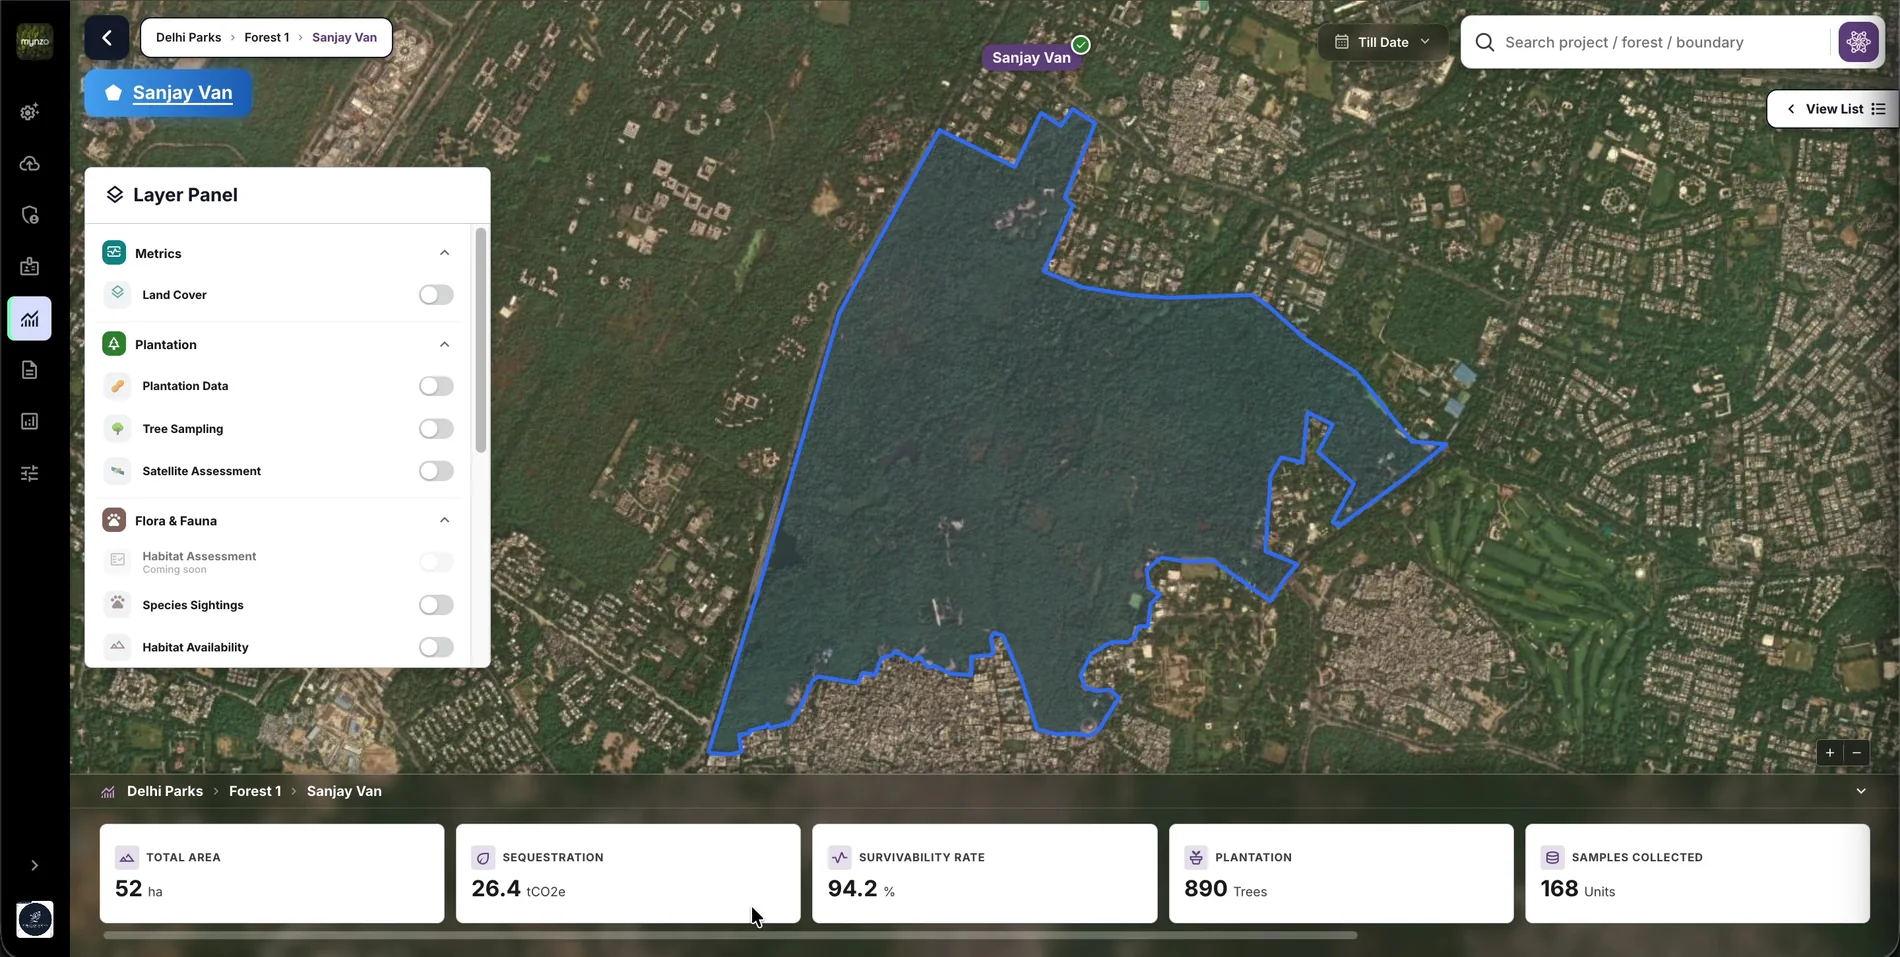 Grouped the way clients track their work: metrics, plantation, flora and fauna. I took the groups from clients' own data sheets.Nothing looks broken. Layers without data yet stay visible but disabled, so clients know what's coming.The real plot. Data is collected inside this boundary, so the map shows exactly where it comes from.
05 / 09 · Land cover
WhyLand cover is the layer clients compare everything else against: how much planting happened in each type of land, and how many species sightings or disturbances fall in it.
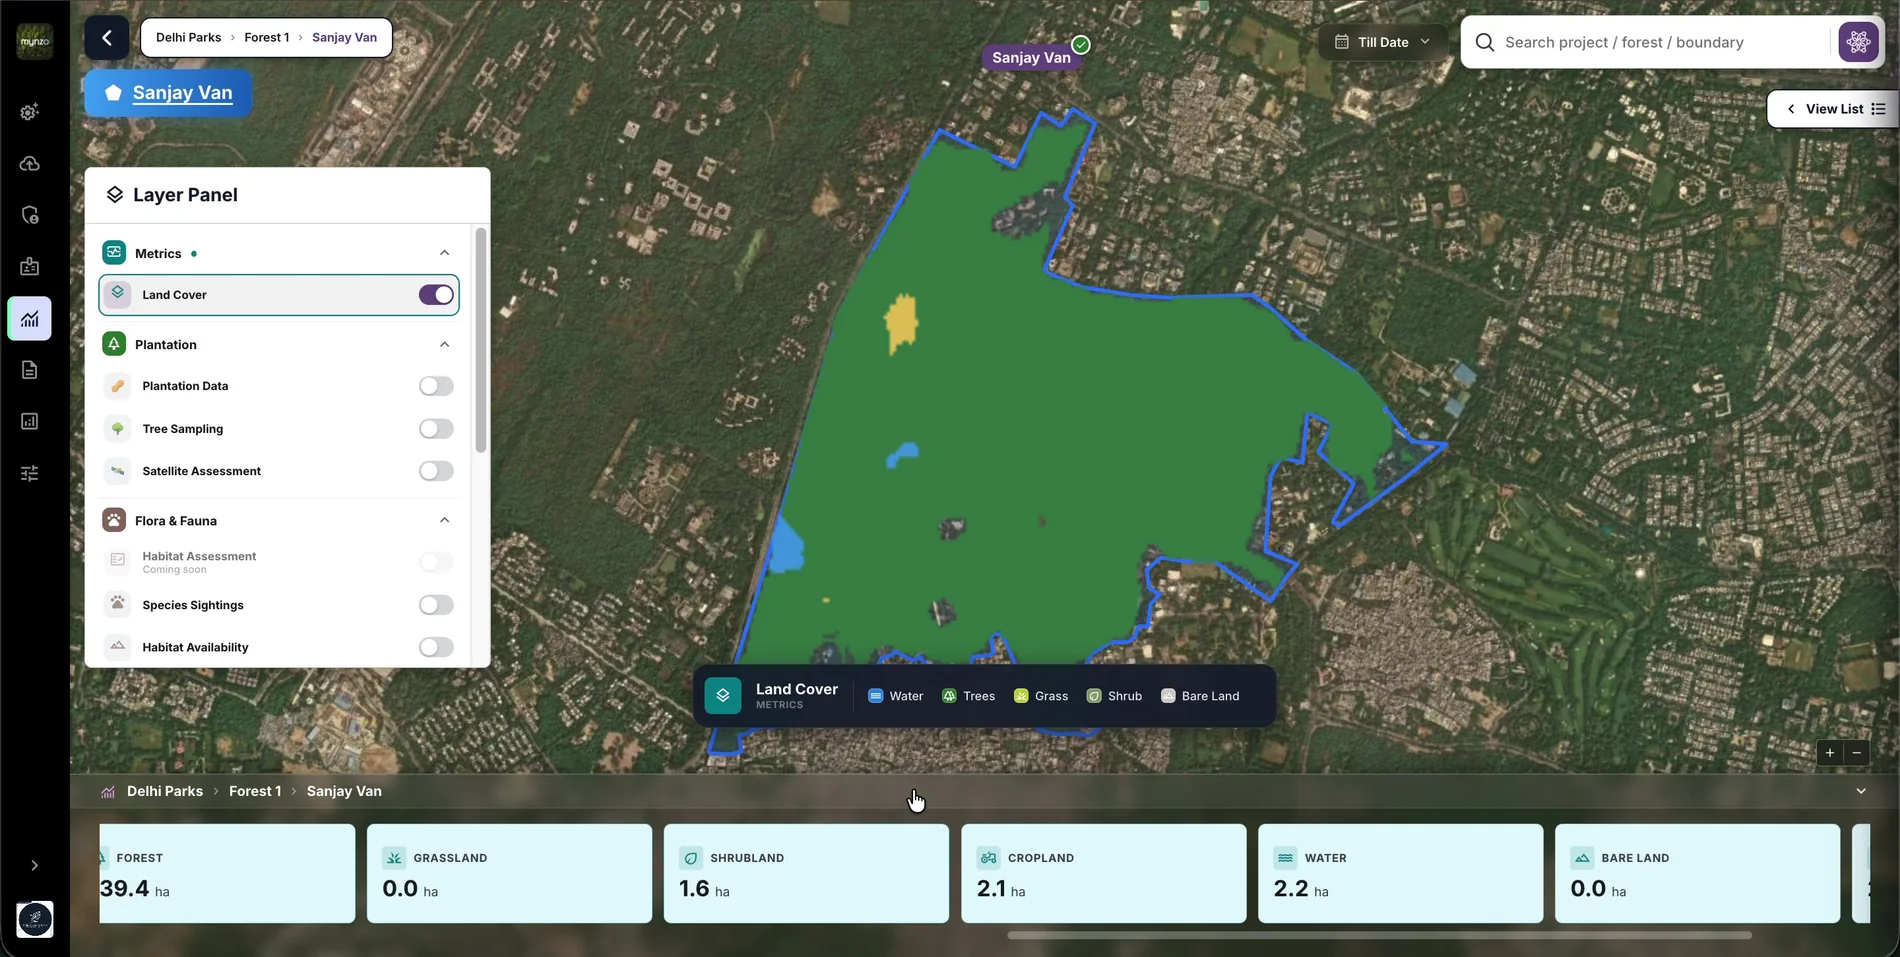 The base for comparison. Clients turn land cover on to read every other layer against it.Every colour is named in the legend, so no one has to guess what the map shows.The numbers switch with the layer: hectares of each land type, for this boundary.
06 / 09 · Tree markers
WhyThe super admin and the EHSO need to know the field team really went to the site and did the work as expected. Research: information priority ↑
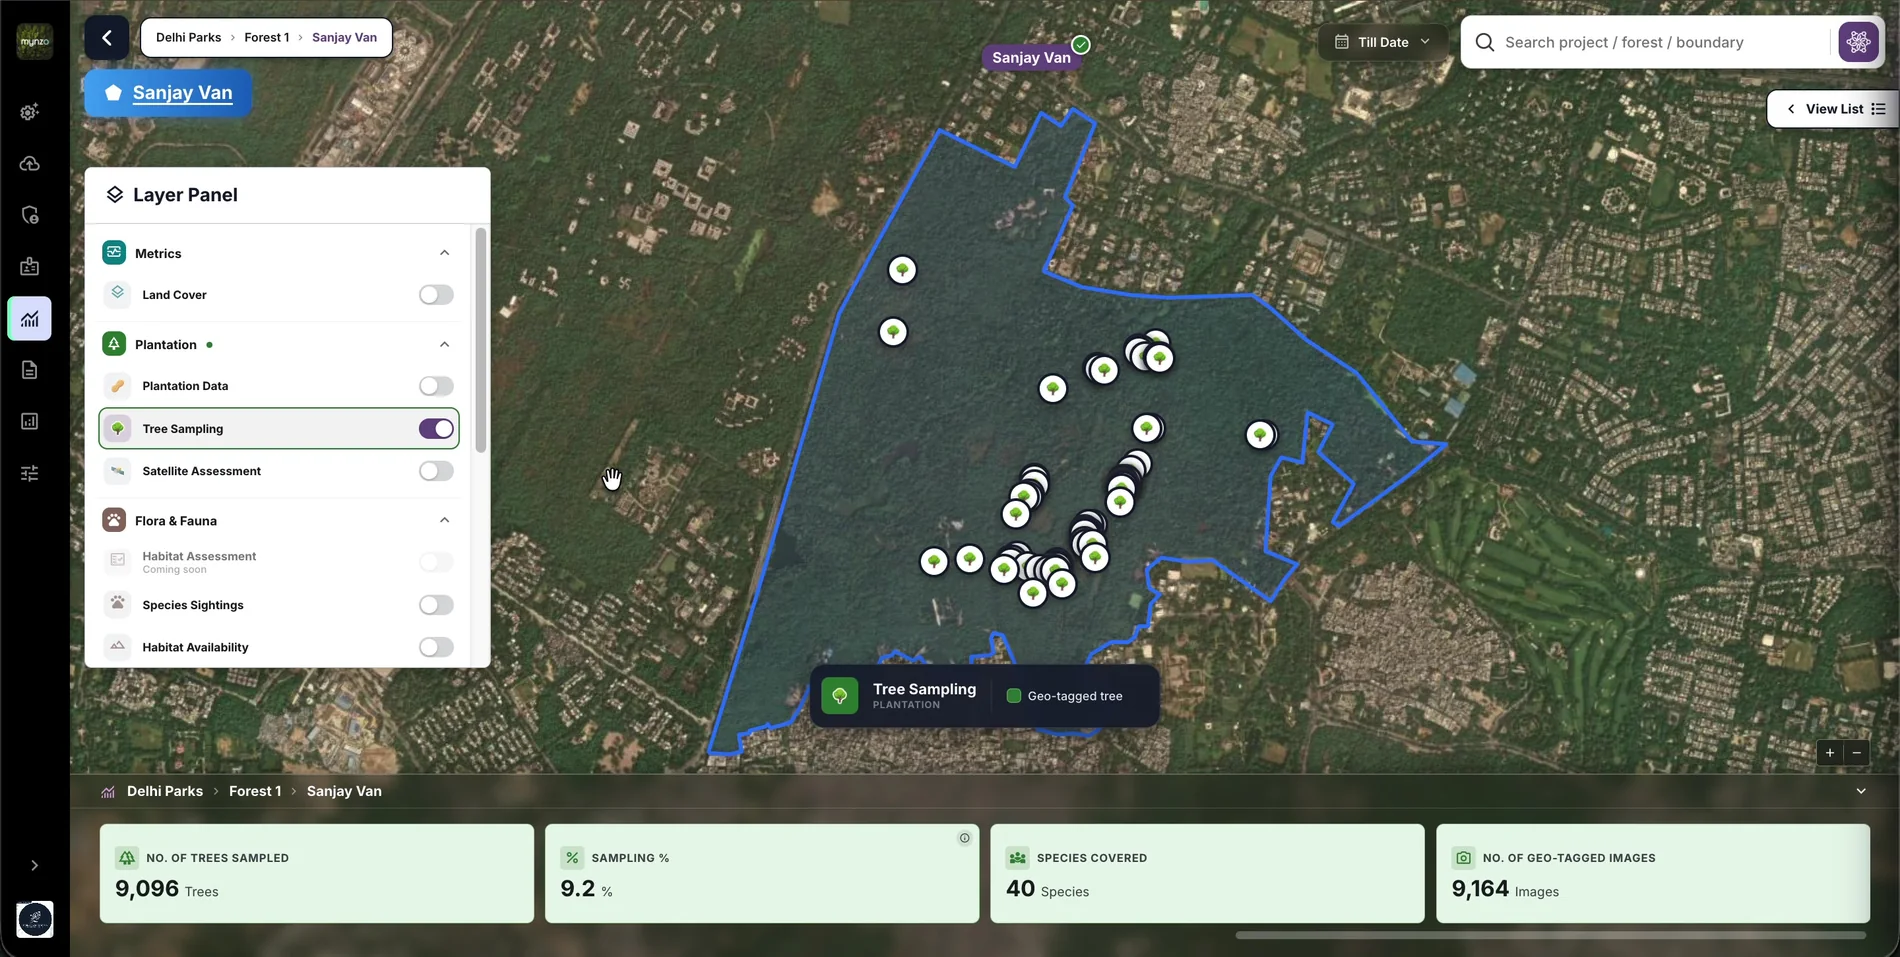 Proof of presence. Each marker sits at the exact latitude and longitude where its photos were taken, so coverage and gaps show on the map.How far collection has got: trees sampled, sampling percentage, species and geo-tagged images, at a glance.
07 / 09 · Tree record
WhyEvery role needs proof, not only the auditor. The super admin and the EHSO check that teams measured each tree as expected; the auditor verifies the numbers. Research: information priority ↑
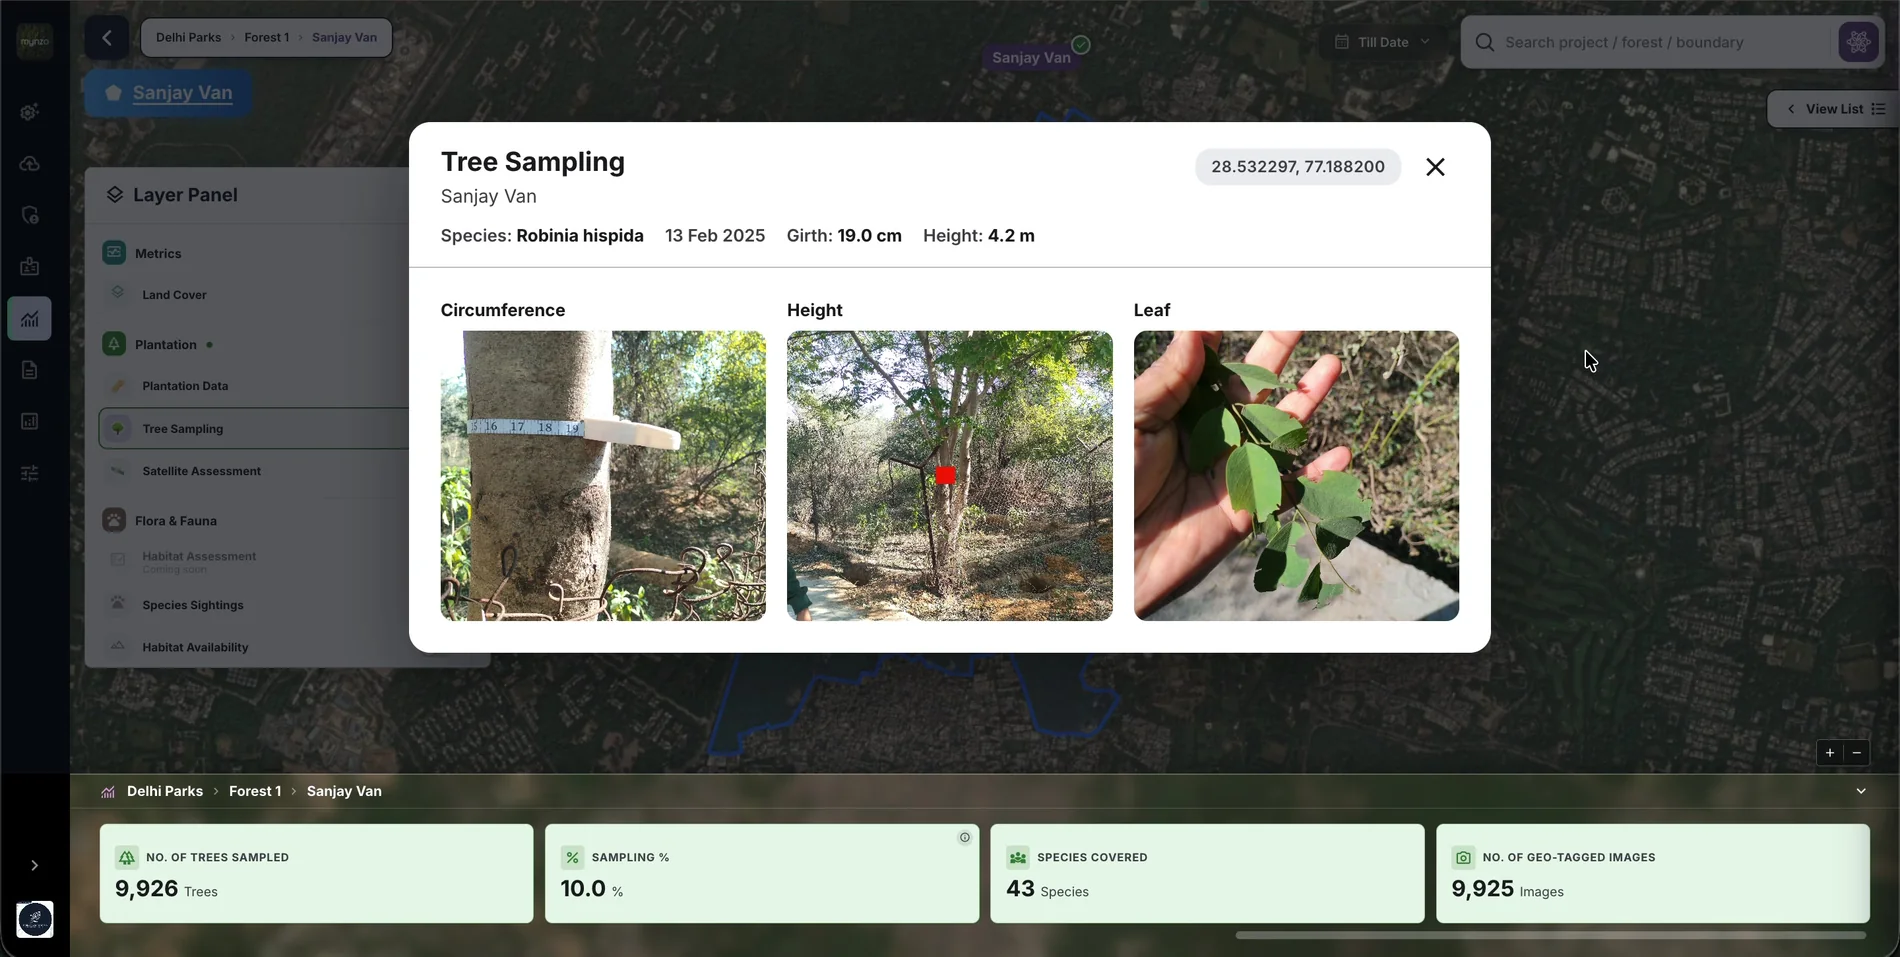 A number you can check. The photo shows the measurement itself, so no one has to take it on trust.Tied to one place. The coordinates link the record back to its marker on the map.
08 / 09 · Species
WhyBiodiversity goes beyond trees: plants, animals, photos, videos and voice notes. Saying how certain each record is keeps the data trustworthy enough to audit.
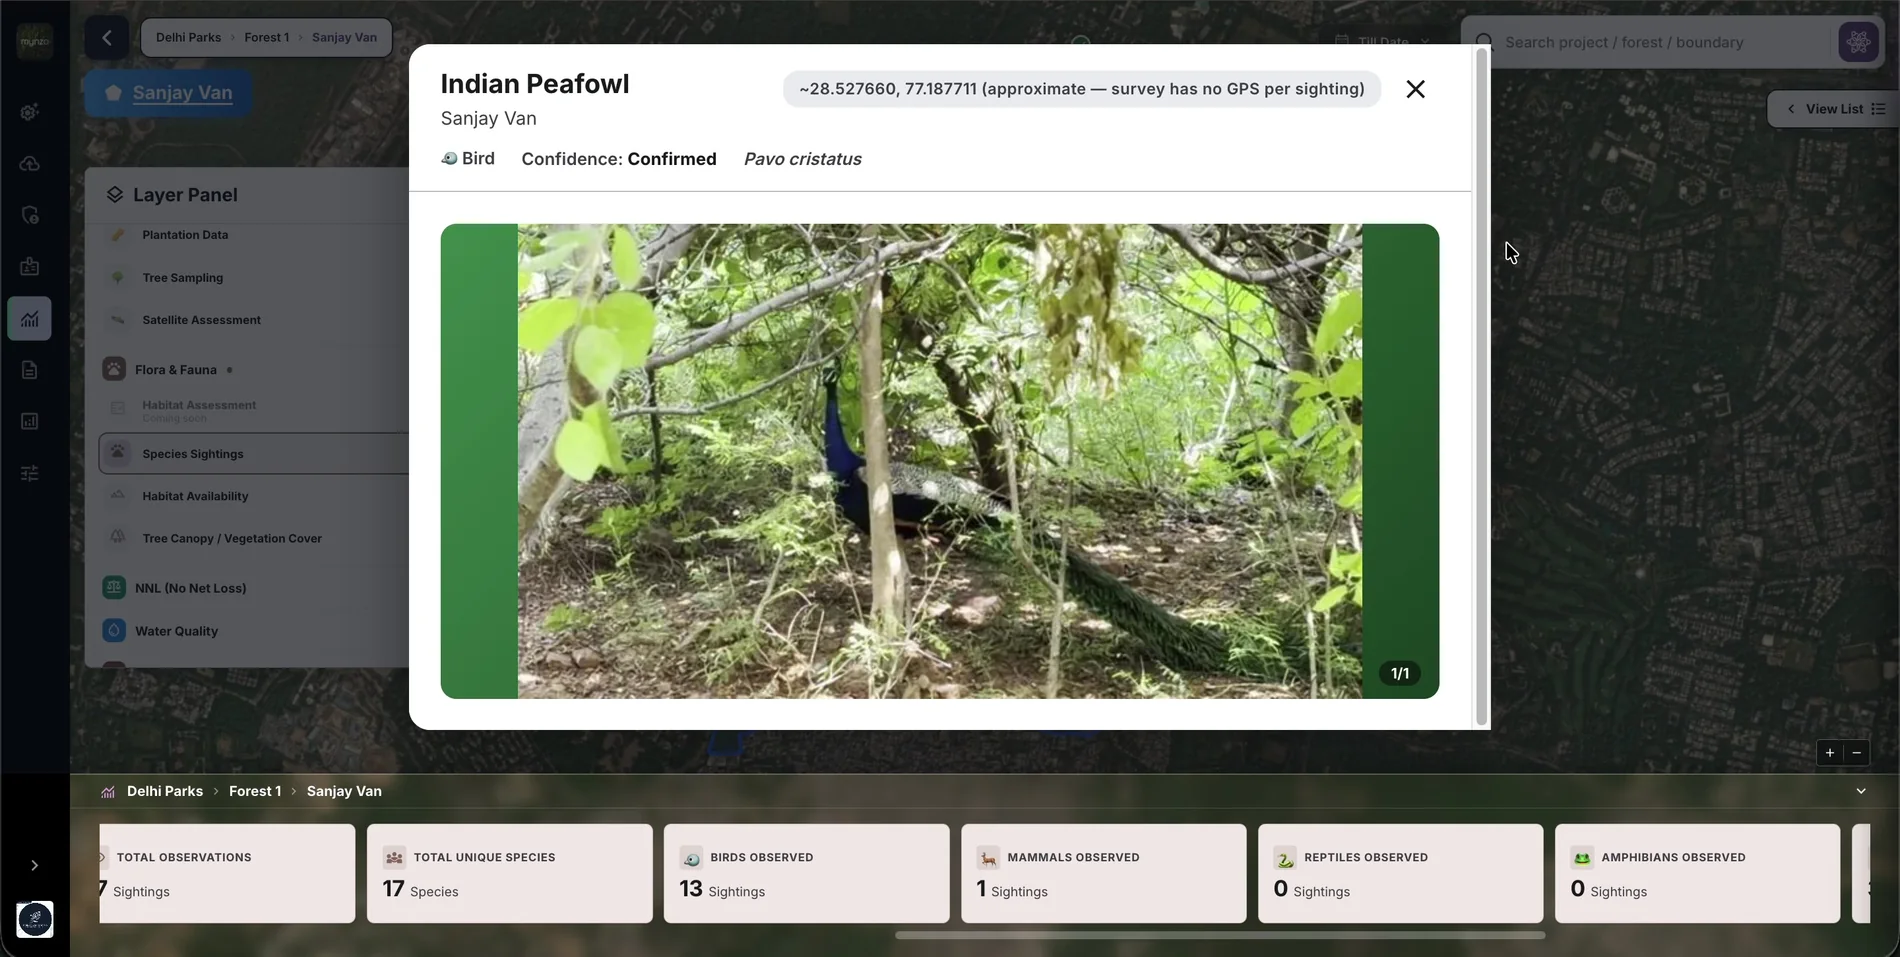 Certainty is stated, not assumed. Each sighting shows its confidence level.No false precision. When the survey has no GPS per sighting, the location is labelled approximate.Counted by group: birds, mammals, reptiles and amphibians, so a gap in the survey is easy to spot.
09 / 09 · Reni
WhyReni is there to help, with anything. It answers questions about the data, generates and exports reports, and helps clients get in touch with the Mynzo team. Decision: Reni, a helping AI ↑
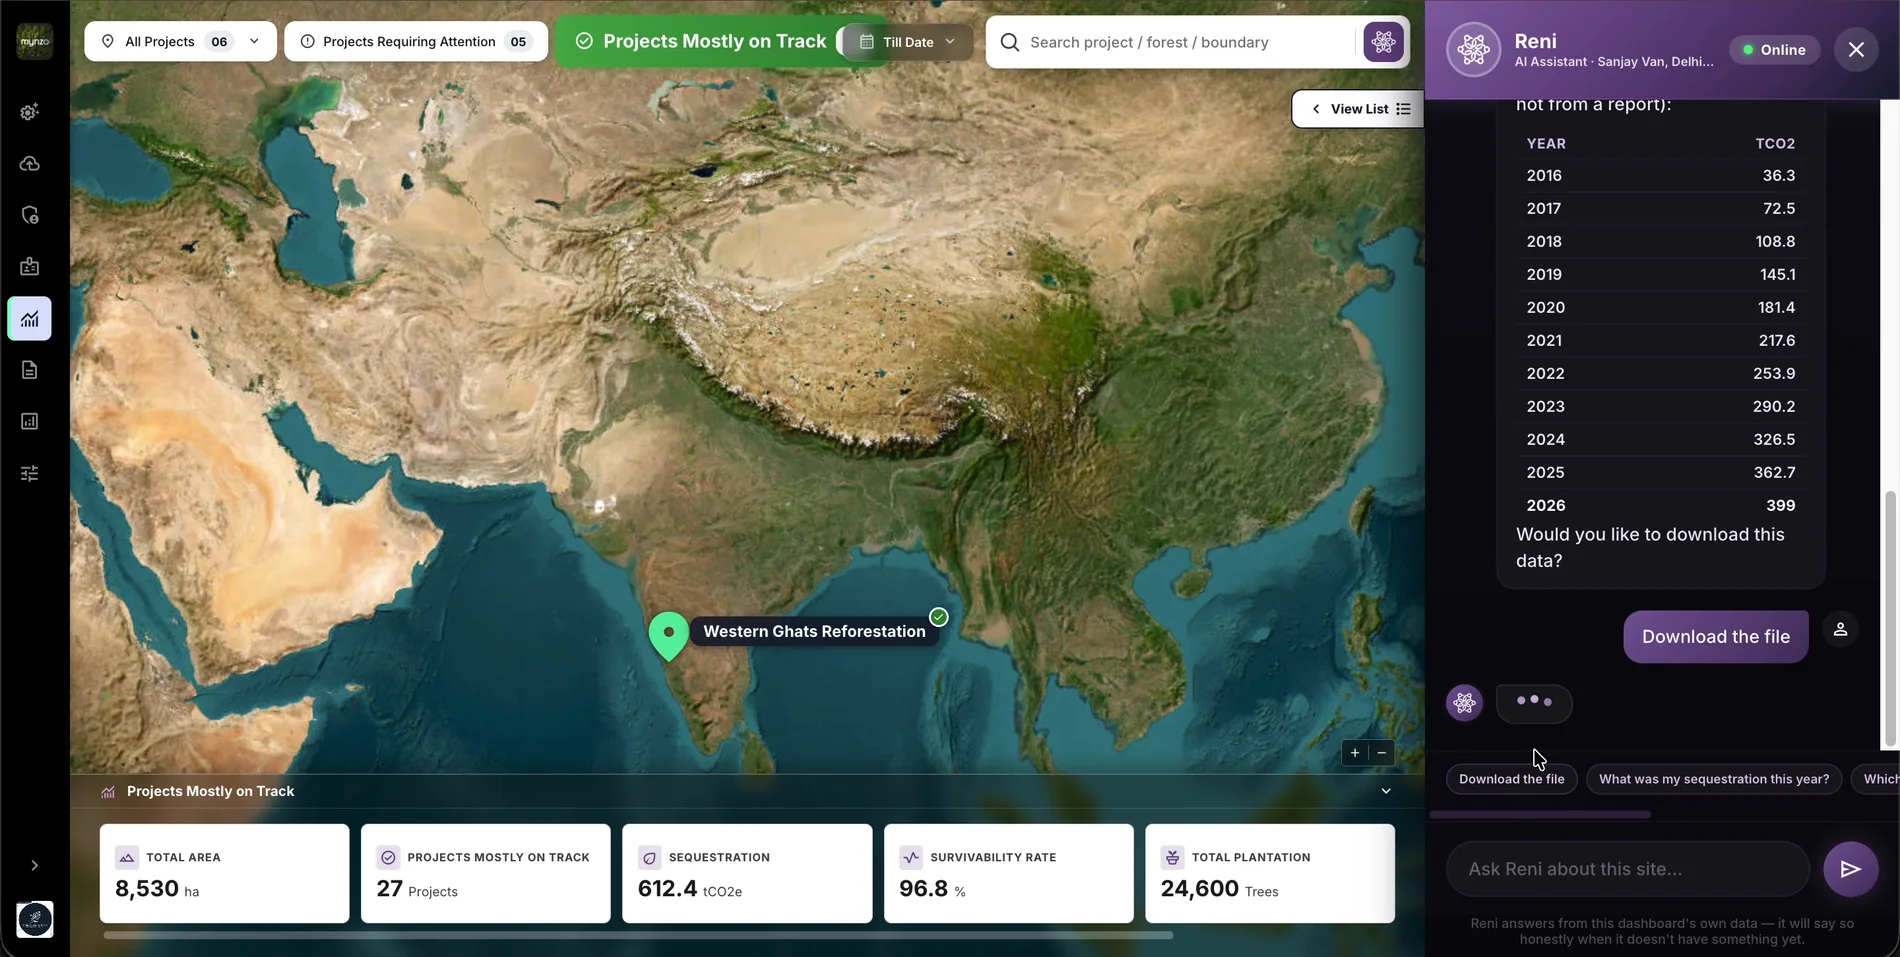 Help without leaving the screen. Reni opens beside the map and knows which site the user is on.Answers in the user's own data, not generic text.A question can become a report. Reni offers to download the answer as a file.
The problem · usability problem
How I solved it
One template, shaped by each role. The information priority from my research decides what each person sees first, access is set by role, and the map works like Google Maps, so nobody needs a walkthrough to find their own forest.
The problem · decision problem
How I solved it
Status comes first. Every project, forest and boundary says whether it is on track or off track, and if one boundary is off track, the forest is too. The question “is everything fine?” is answered before any number, and the reason is one click away.
The problem · data problem
How I solved it
The map holds everything and reveals more as users zoom in: project, then forest, then boundary. Every view follows that grouping, the numbers change with the level, and search finds any boundary directly.
The problem · business problem
How I solved it
Clients now serve themselves. Every report lives in one library and clients can build their own, field data comes in through a template the system reads automatically, and access is managed in the platform instead of by our team.
In the MVP, reports were files to download, and our team made each one by hand. On the new platform, every report lives in one library, and clients can generate their own.
Walkthrough
Scroll through the live product. Each ?Why on a screen opens the reason behind that decision.
01 / 06 · Library
WhyIn the MVP, reports were files our team made by hand and sent over. Reports were a primary need for the sustainability head and the auditor, so they get one library they can use on their own. Problem 04: growth meant more manual work ↑
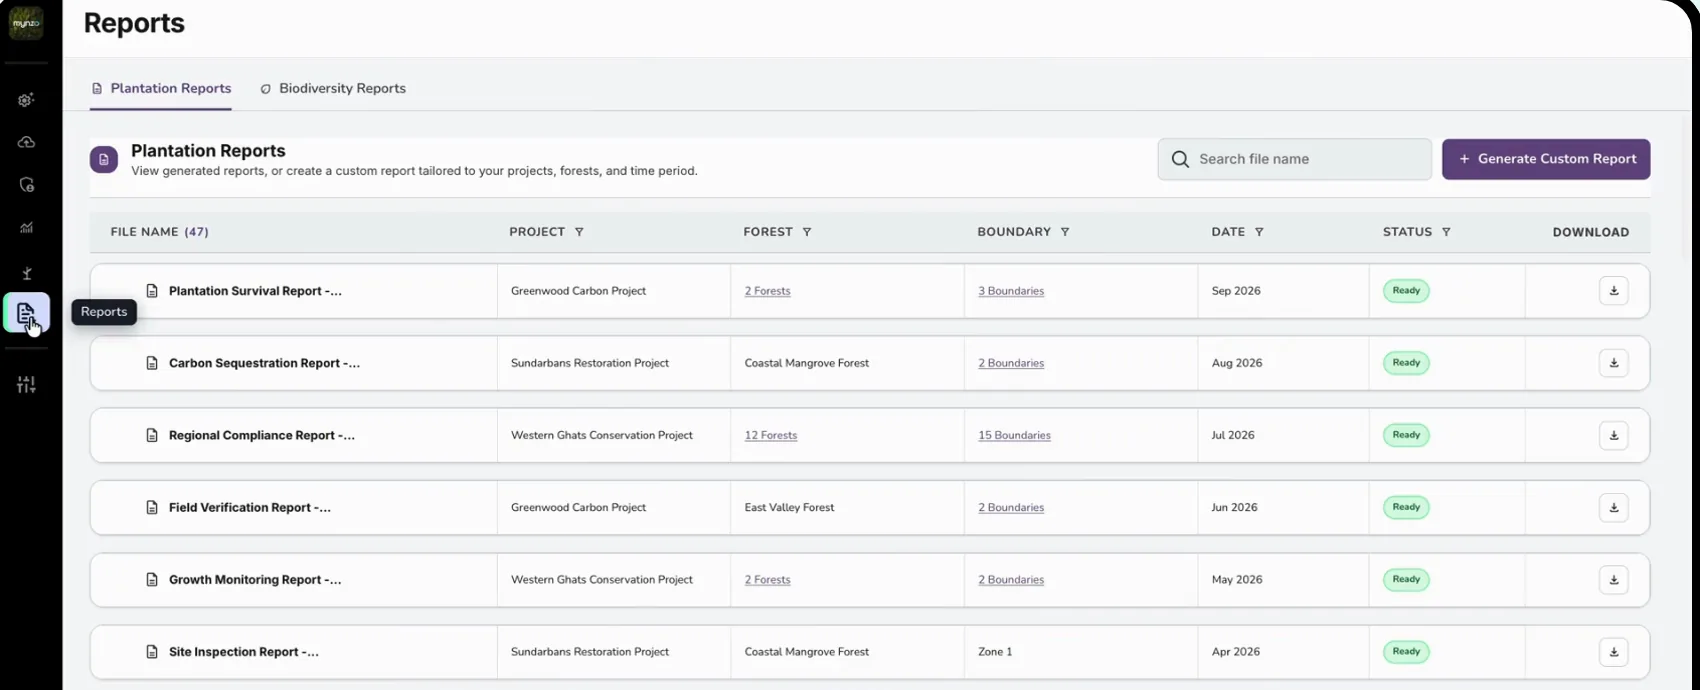 Two kinds of report, two tabs: plantation and biodiversity.Every report is tagged with its project, forest and boundary, the same spine as the rest of the dashboard.Status and download sit side by side. “Ready” means one click to download.Generate Custom Report lets clients build their own, without asking our team.
02 / 06 · Filters
WhyWith many projects, forests and boundaries, a long list of reports is only useful if you can narrow it fast. Filtering in the column keeps the table and the filter in one place.
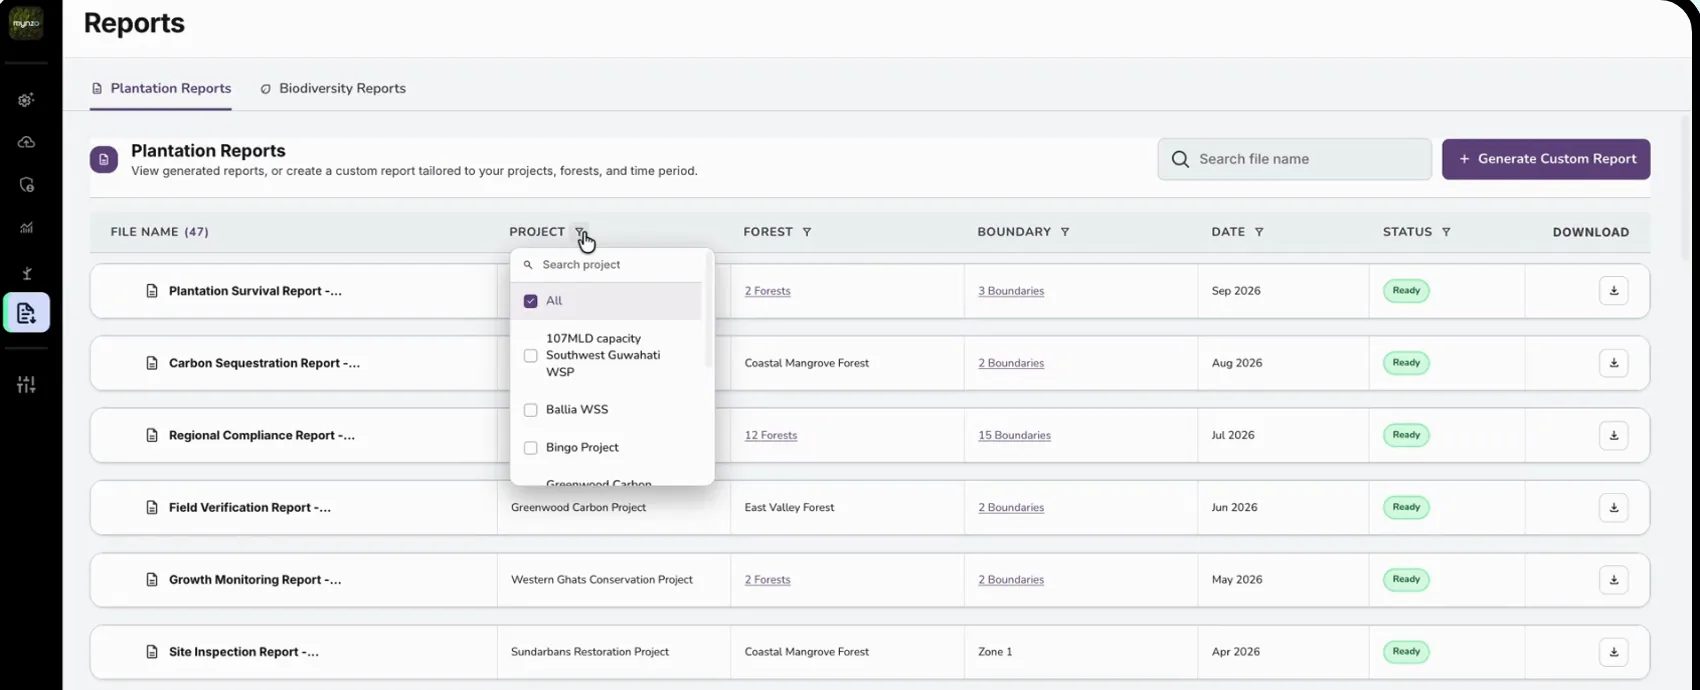 Each column filters itself: project, forest, boundary, date and status, with search inside the list.Counts link through: “2 Forests” or “3 Boundaries” show what a report covers.
03 / 06 · Steps
WhyA report builder can easily become a wall of options. Numbered steps that unlock in order make it hard to build a wrong report.
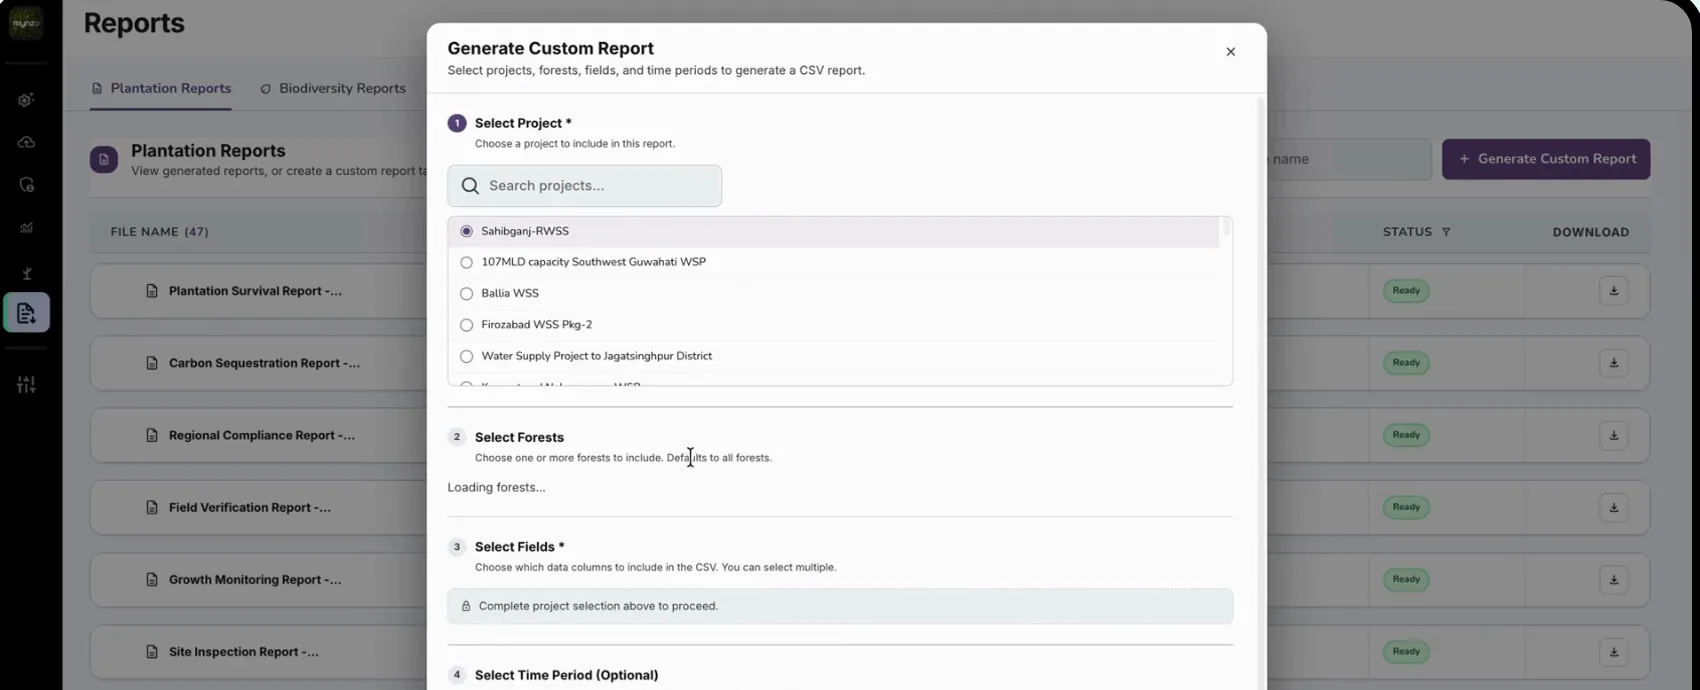 Step 1: choose a project. Everything else depends on it.Step 2: choose forests. It defaults to all forests, so the common case needs no extra clicks.Later steps stay locked with a clear note until the step before is done.
04 / 06 · Fields
WhyThe people building reports are not data specialists. Plain descriptions mean they pick the right columns the first time.
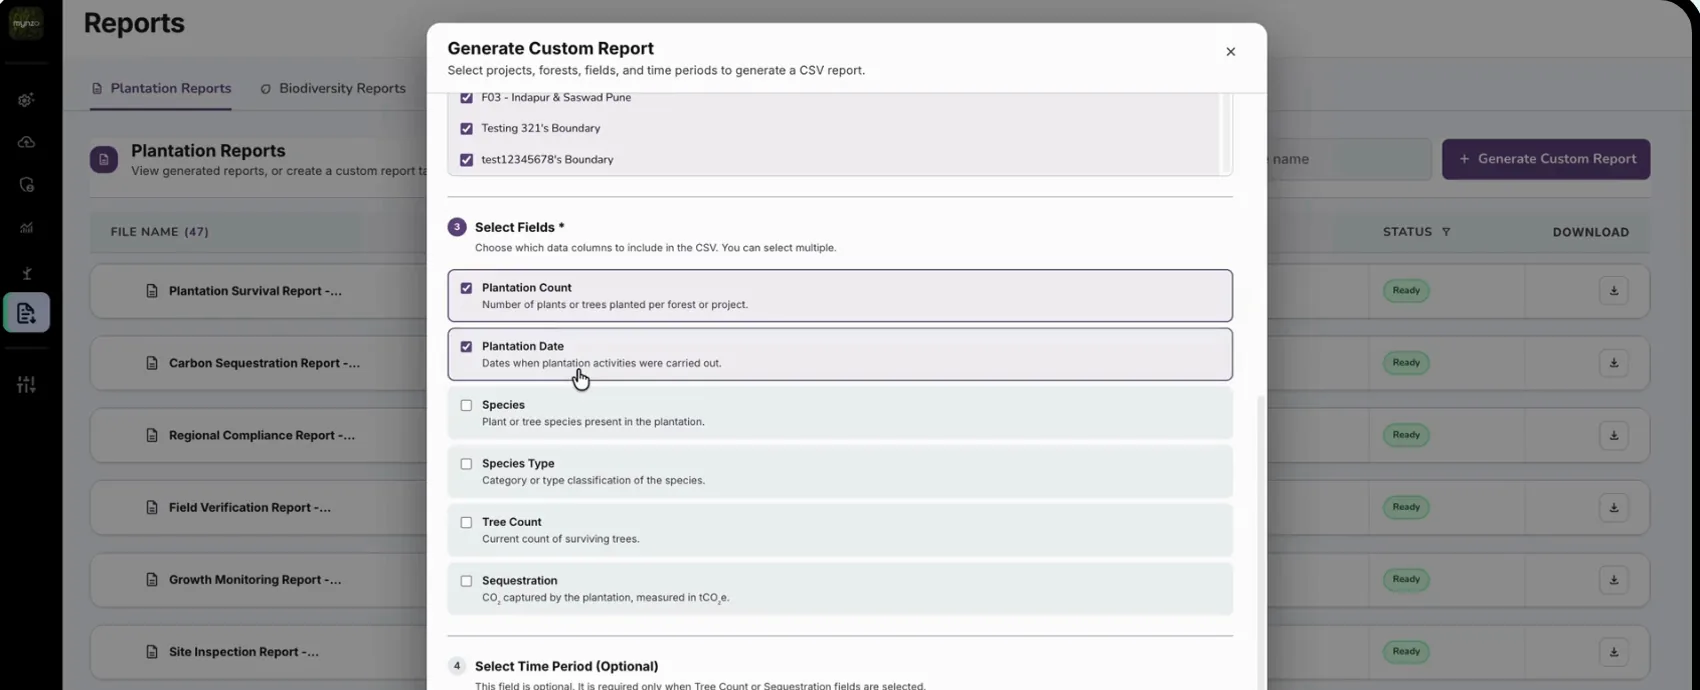 Every field explains itself in one line, like “Number of plants or trees planted per forest or project”.Units are stated, like sequestration in tCO₂e, so the numbers can't be misread.
05 / 06 · Status
WhyGenerating a report takes time. A visible status shows the request was received, so nobody clicks twice or emails our team to ask.
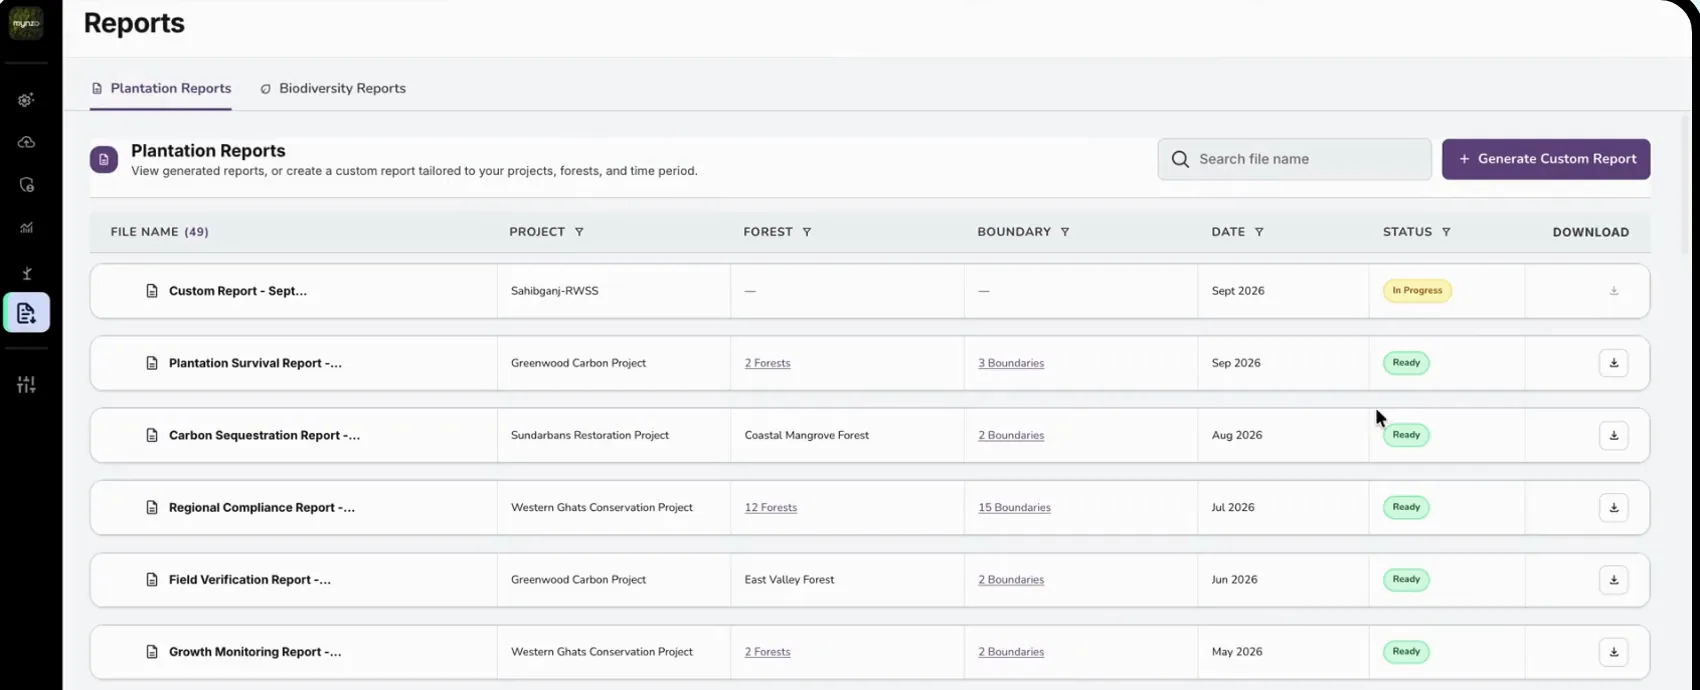 The new report appears at the top of the list straight away.“In progress” turns to “Ready” when the file is done, and the download button switches on.
06 / 06 · Biodiversity
WhyClients report biodiversity against these frameworks. Labelling each file by framework means they can find the one they need to submit.
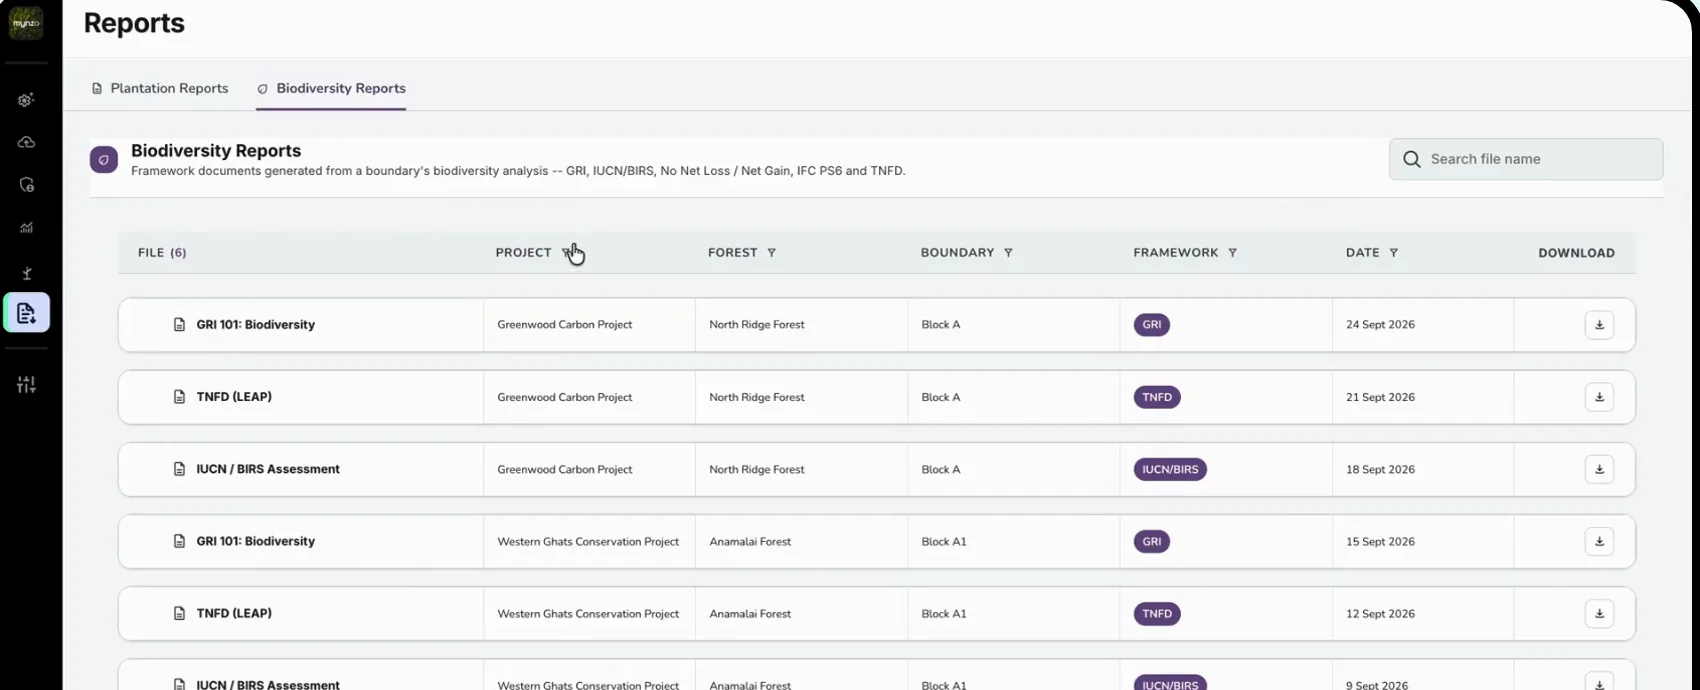 Generated from a boundary's biodiversity analysis and named for the framework: GRI, IUCN/BIRS, No Net Loss, IFC PS6, TNFD.A framework column shows at a glance which standard each file follows.
Stage 5 of 5
Build and shipBuild the front end and release it to clients.
I built the entire front end myself, in HTML, CSS and JavaScript, so what shipped matched the design. Because I handed over working code, not mock-ups, our developer could ship it almost straight away. The tech team connected it to the backend, our AI models and satellite processing.
Said during the demo by clients who went on to sign. Four more clients came on board in October, after seeing the updated dashboard.
It looks very easy to use.
It caters to all our needs.
They also singled out the roles, and the access given to each role, as exactly what they needed.
Who uses it now
The answer each person needs matters more than how much data we can show.
Changes on paper cost far less than changes in code.
The reason something isn't on a screen matters as much as what is.